The bear case for stocks seems very well known in my opinion. High inflation, lingering for longer, a Fed that continues to hurt more than it helps, earnings & margin deterioration as the effect of tight financial conditions works its way into corporate and consumer spending, etc. There can always be new problems that arise: consumer spending slows further as food and rent costs eat further into savings and wage pressures & lack of skilled labor pinch corporate balance sheets, or credit markets seize up further. Because we live in a algo-driven world and stock market, any headlines can and will be used to drive short term directions. From my perch, however, it seems like the bear case is widely known and allocated for and the market is heavily leaning in the bear direction, low volume holiday rallies not withstanding. What happens when/if things do not stay as bad or simply get slightly better than really bad? Often, the best gains happen when things go from horrendous to slightly less horrendous. And with such bearish positioning and sentiment, any hint of good news will force bears to position for a slightly less bearish outcome and thats a lof of money running through a very narrow door. I do not know when this will happen but I feel confident we have a period sometime in the next year where a seller strike drive a wicked rally that most do not expect. We shall see.
Here’s a few charts from Global Macro Investor that highlight where we are today.
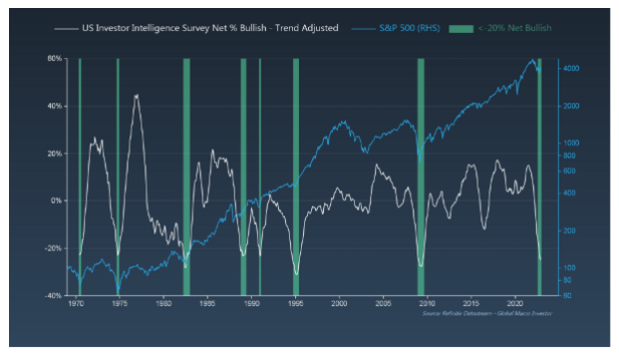
Everybody is already bearish, this chart goes back to 1970 folks. Bearish sentiment like we have now is a very rare thing and has always been a wonderful contrarian signal at some point. I guess it all depends on the Fed and getting to the place they feel is warranted. A “halting of rate hikes and sitting tight” message is a catalyst.
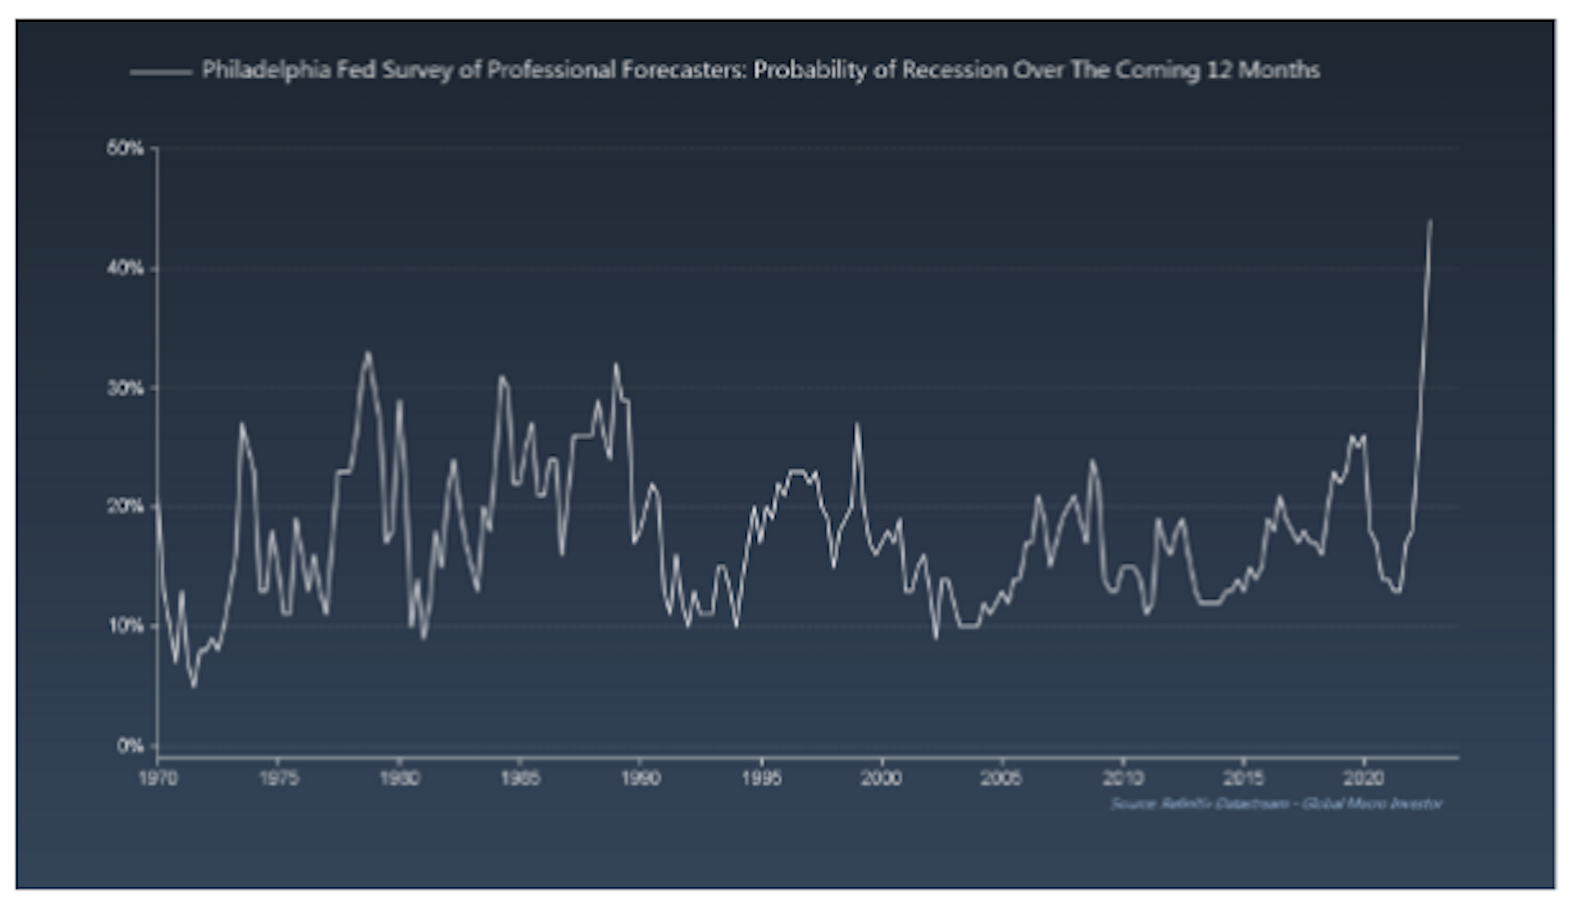
The Philly Fed Survey: Probability of recession in the forward 12 months. THE most anticipated recession ever.
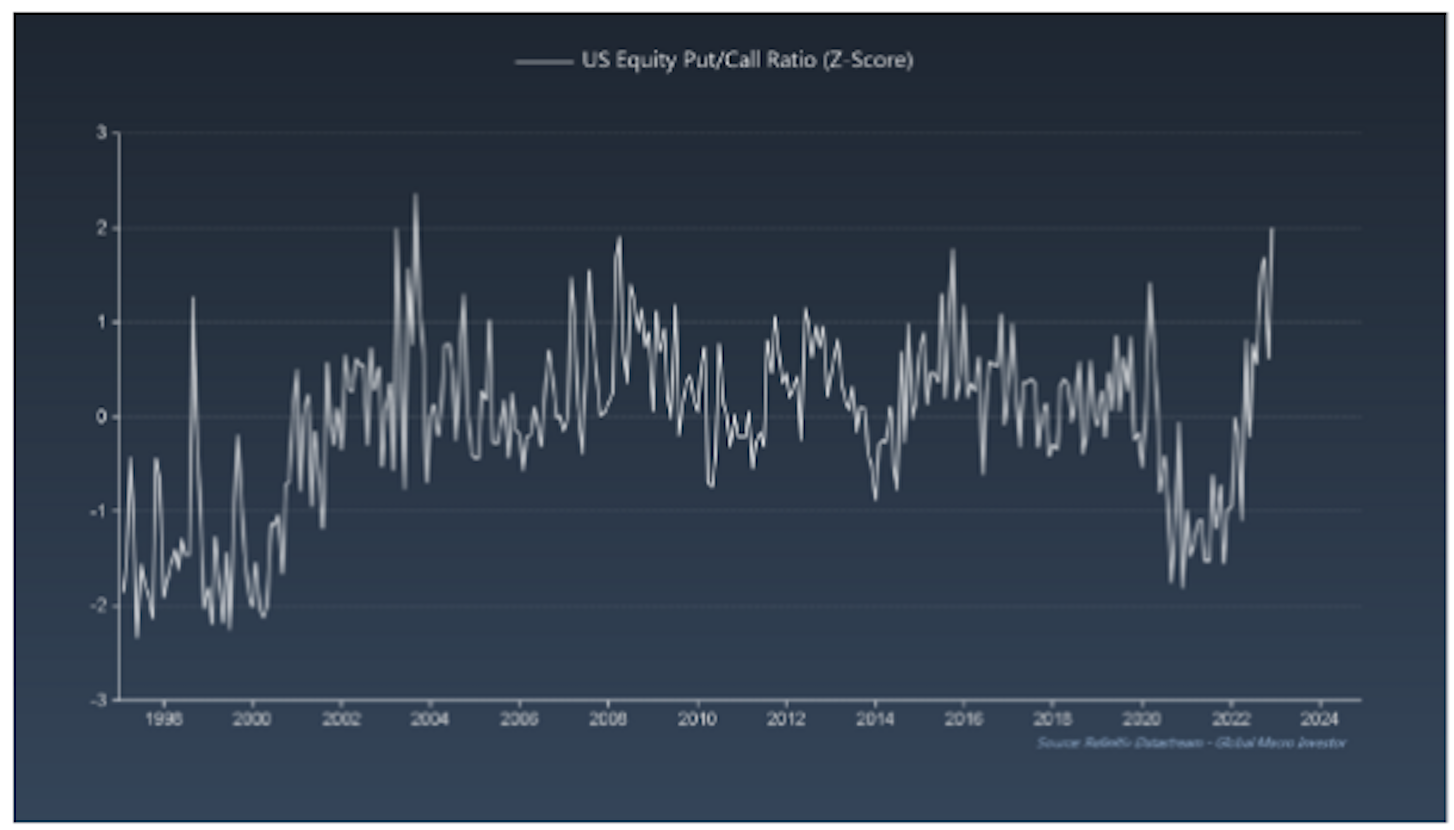
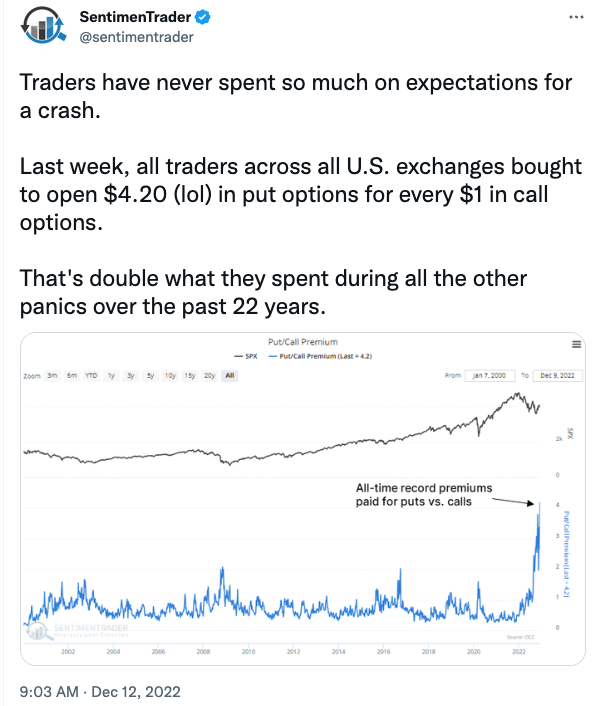
Whether its a hedge or an outright bearish bet, the US equity put/call ratio recently reached a 20-year high as investors scramble to accumulate downside protection. This chart is less compelling to me because we saw similar action in the fall of 2008 and those investors were spot-on with that bet. But generally, these extremes tend to be contrarian signals.