bear market

More Sentiment Info and Institutional Asset Manager Positioning Extremes

2/27/23

February is almost over, not nearly as intriguing as January from a returns perspective!

The 10 month moving average for the S&P 500 is about 3947 so I’d like to see us close again over that level for two months in a row, that tends to be a pretty positive outcome but the inflation and Fed data seems to be pushing markets around at will.

Positioning was quite extreme and bearish at the end of 2022 and we saw a wicked ramp in January. Since that time, AAII sentiment has ripped back with stock prices going up but with the correction, sentiment has fallen back down to lows. Perhaps everyone is correct but after 30 years of investing, I’m a bit wired to be more positive when the masses are very negative and extreme. Timing is everything though.

Here’s an interesting chart showing buying of VIX calls has gone vertical and back to levels not seen since March 2020, close to the Covid lows. People are clearly bearish and/or positioning with VIX calls to hedge their longs. Honestly, I don’t think that’s a bad trade given VIX is back under 20, I think VIX and markets could be rangebound for a bit longer as the data and Fed chop around.

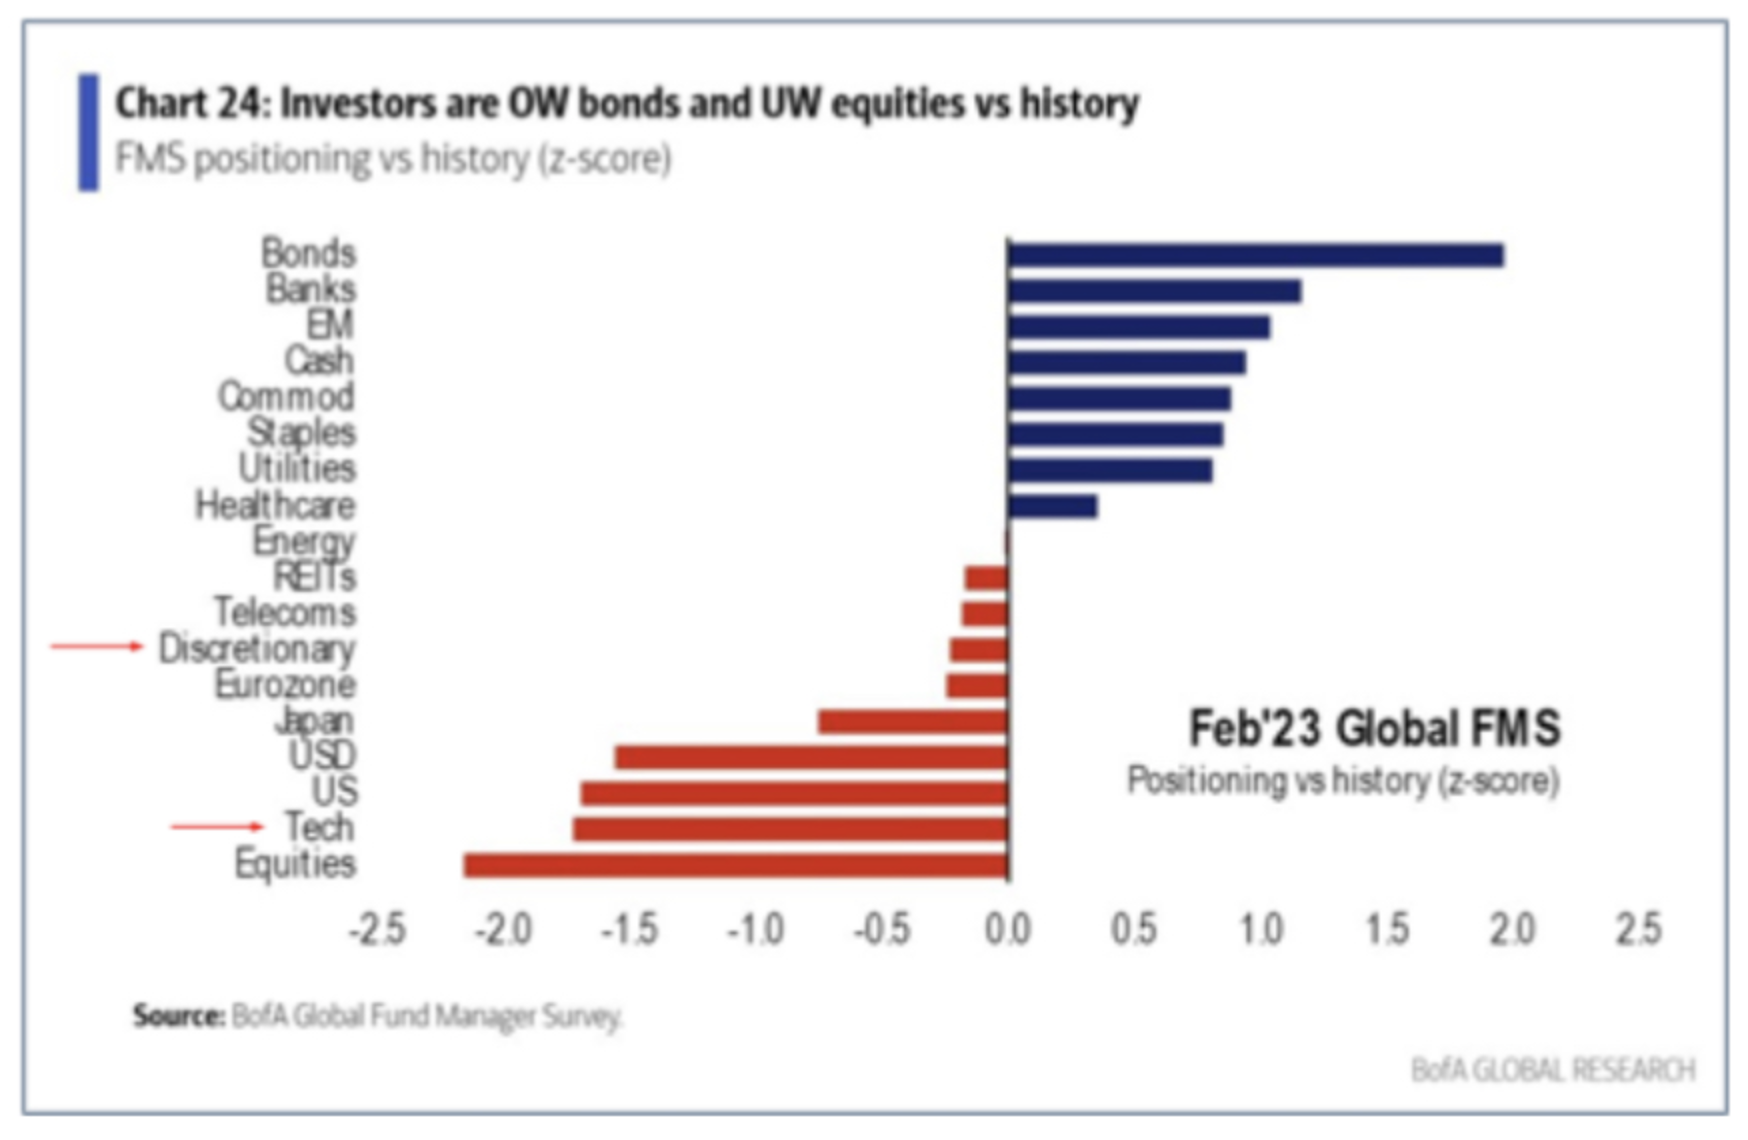
Here’s the February look for institutional money managers, again VERY bearish stocks, Tech in particular as rates have risen back to highs and markets have gotten soft again.

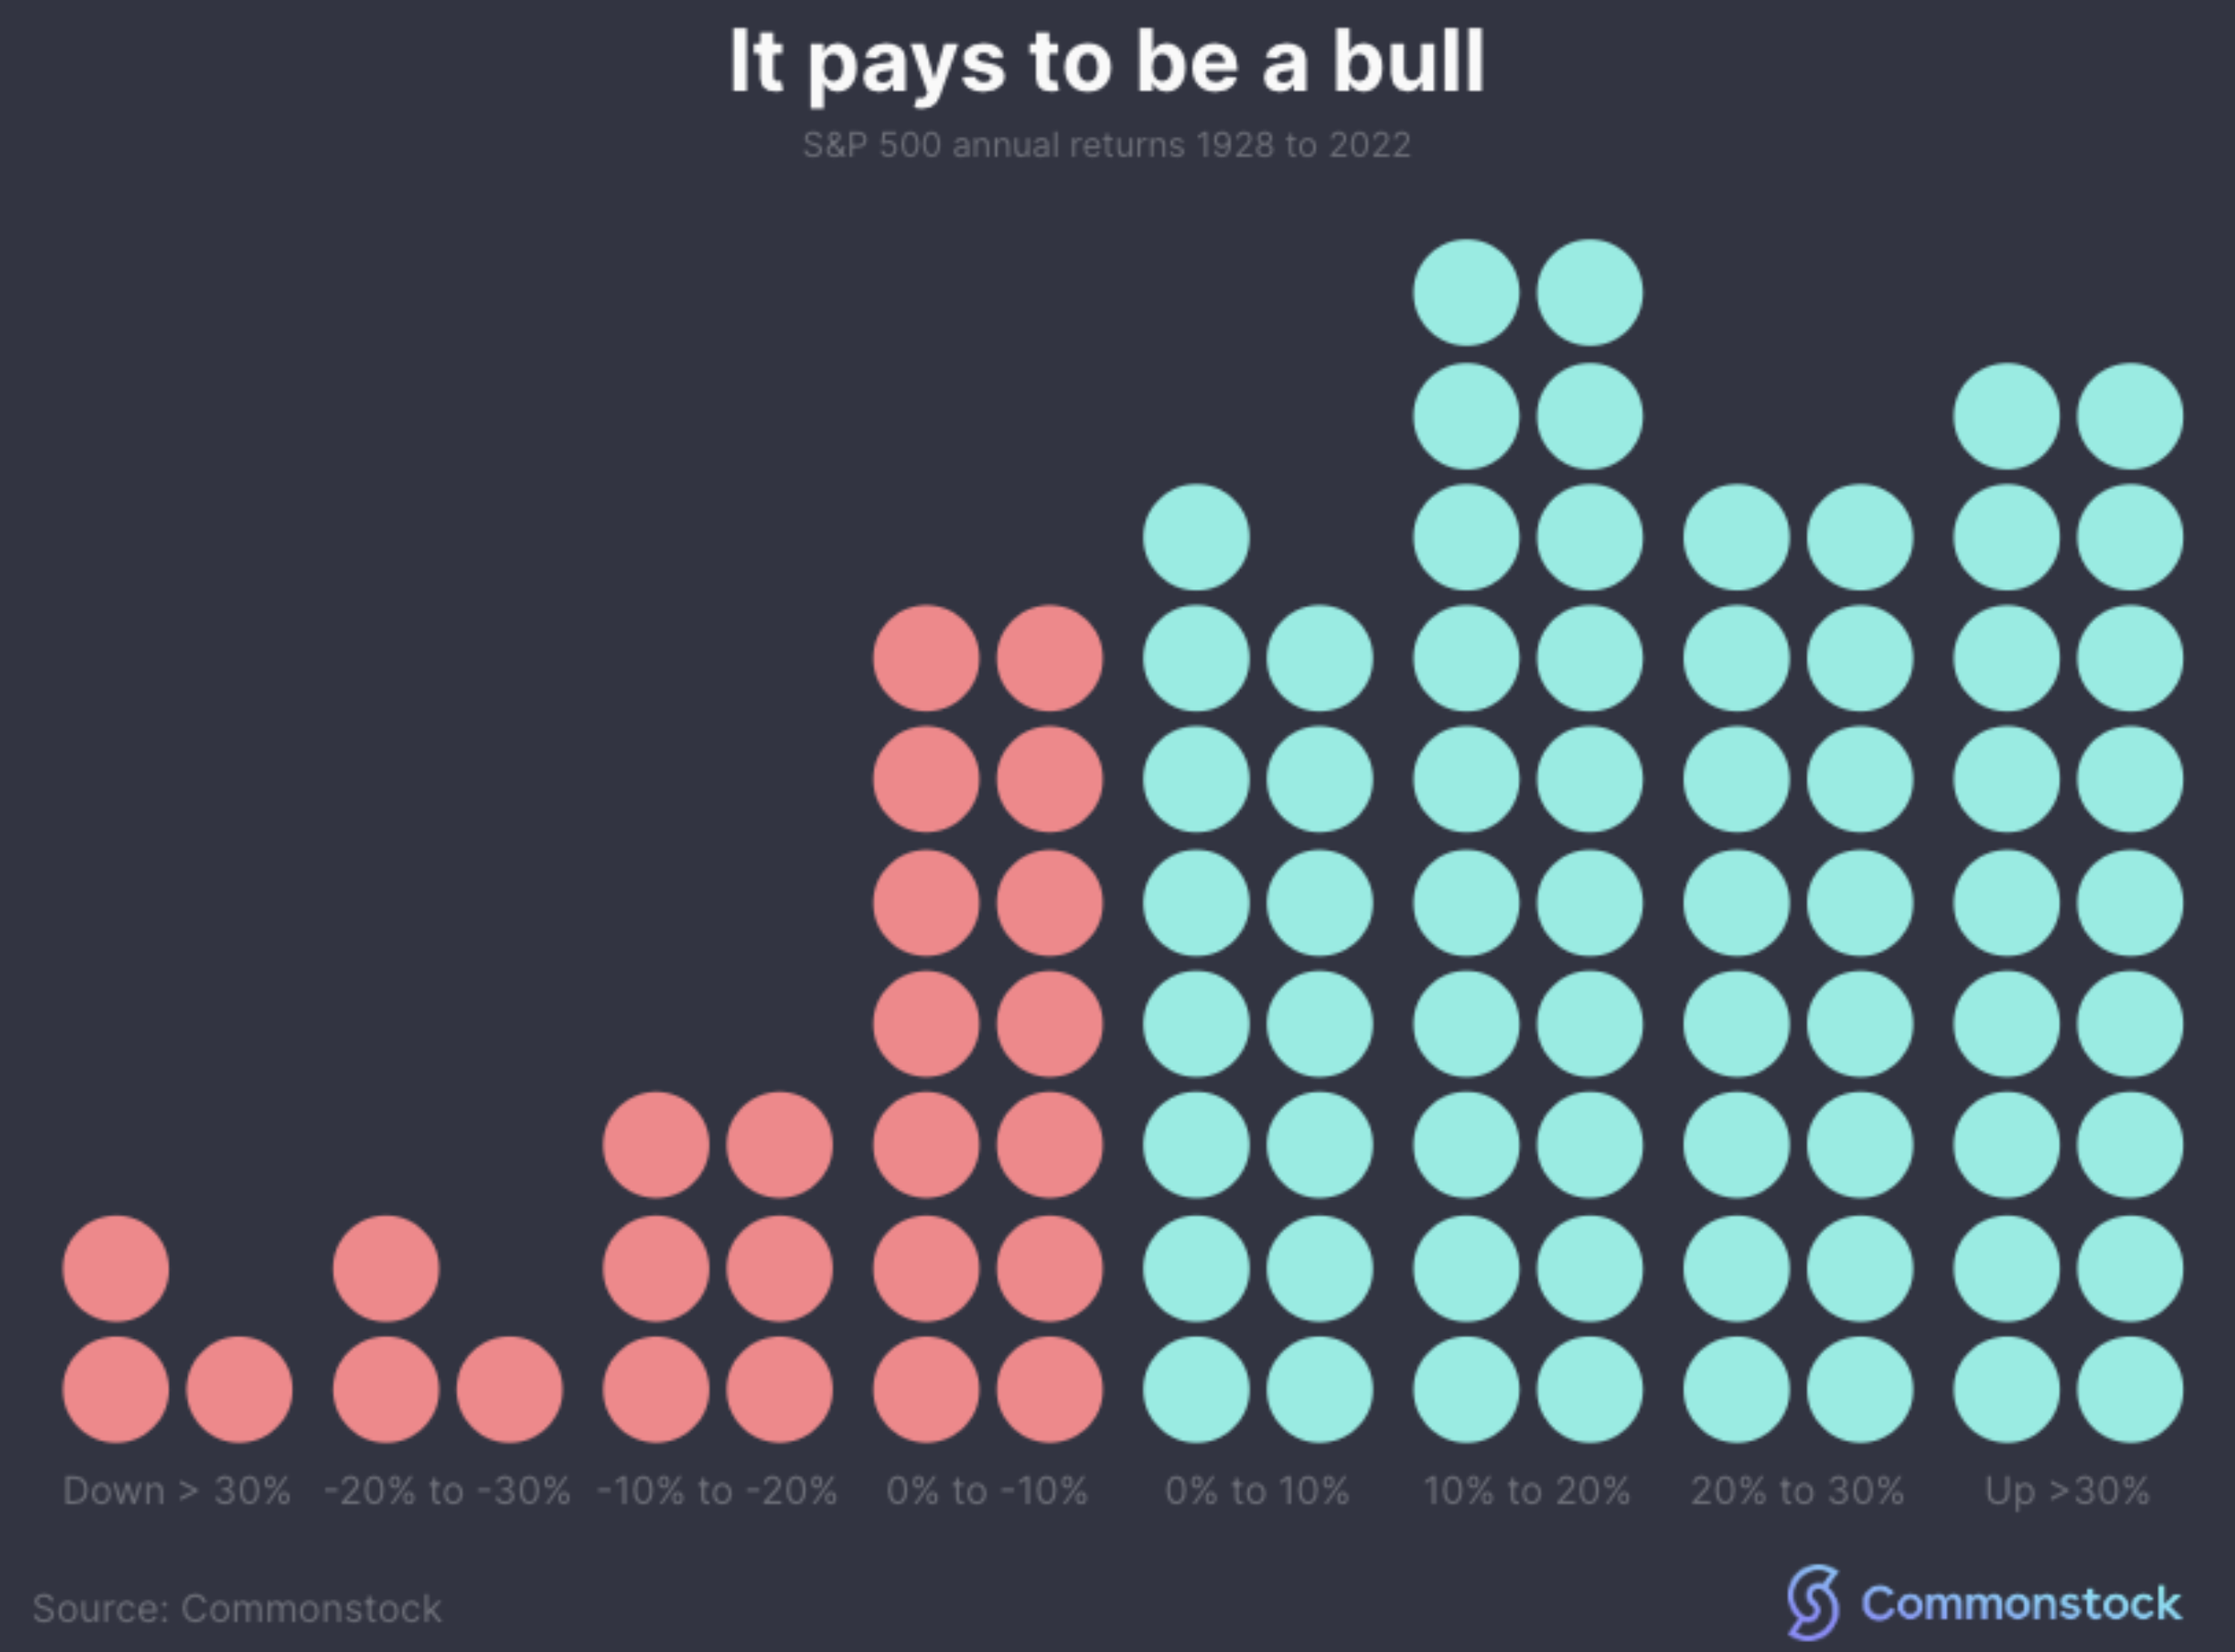
I understand people do not want to lose money, or age, or get shorter as they age, or get slower as they age, but the reality is: it happens. Stocks don’t always go up, they can be volatile some times, the markets act unbelievably irrational at times because human emotions drive decisions along with computers that just trade on very short-term momentum signals and key words. The most successful investors understand VOL is part of the package and they use VOL, when it appears, to their advantage and they add to their favorite long-term holdings at better prices. That’s what you are supposed to do, so while the market is digesting this epic “normalization phase” directed by the Fed, just keep accumulating more shares of your favorite companies. This betters your cost basis, and gets you bigger in names you love. That helps you sleep at night. Remember, if VOL and big swings keep you up at night, you don’t have confidence in what you own, you may be too exposed to the asset class in question, and/or you may just be thinking too short-term. Here’s a little reminder, the odds for being long and invested are overwhelmingly in your favor if you have time on your side. Stocks are positive the bulk of the time and they rarely cluster around “average”, which is about 10% a year pre the ZIRP madness of 2009-2022. If you have some funds or ETF’s that have 1 & 3 year returns well under the long term average, that’s likely telling you it’s time to build bigger positions unless you’ve picked some crazy strategies. We focus on household consumption and business investment through the most relevant and leading brands. That’s a $44+ trillion a year thematic so I feel quite confident we are fishing in the right pond.

Sentiment and Positioning Still Offsides?

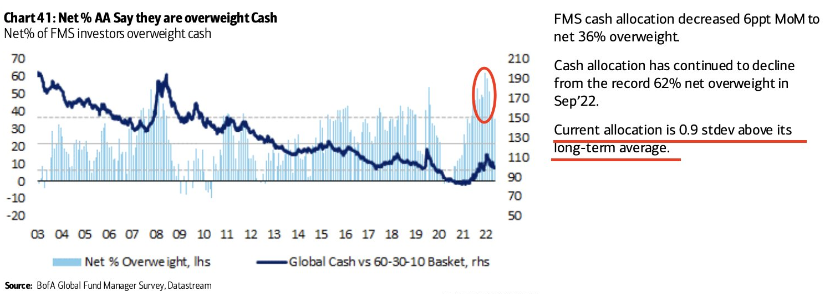
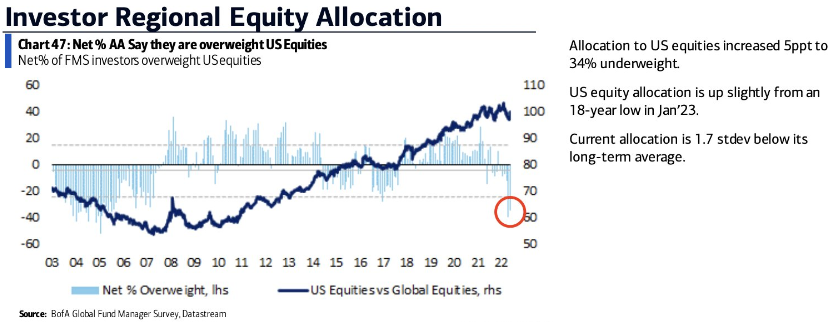
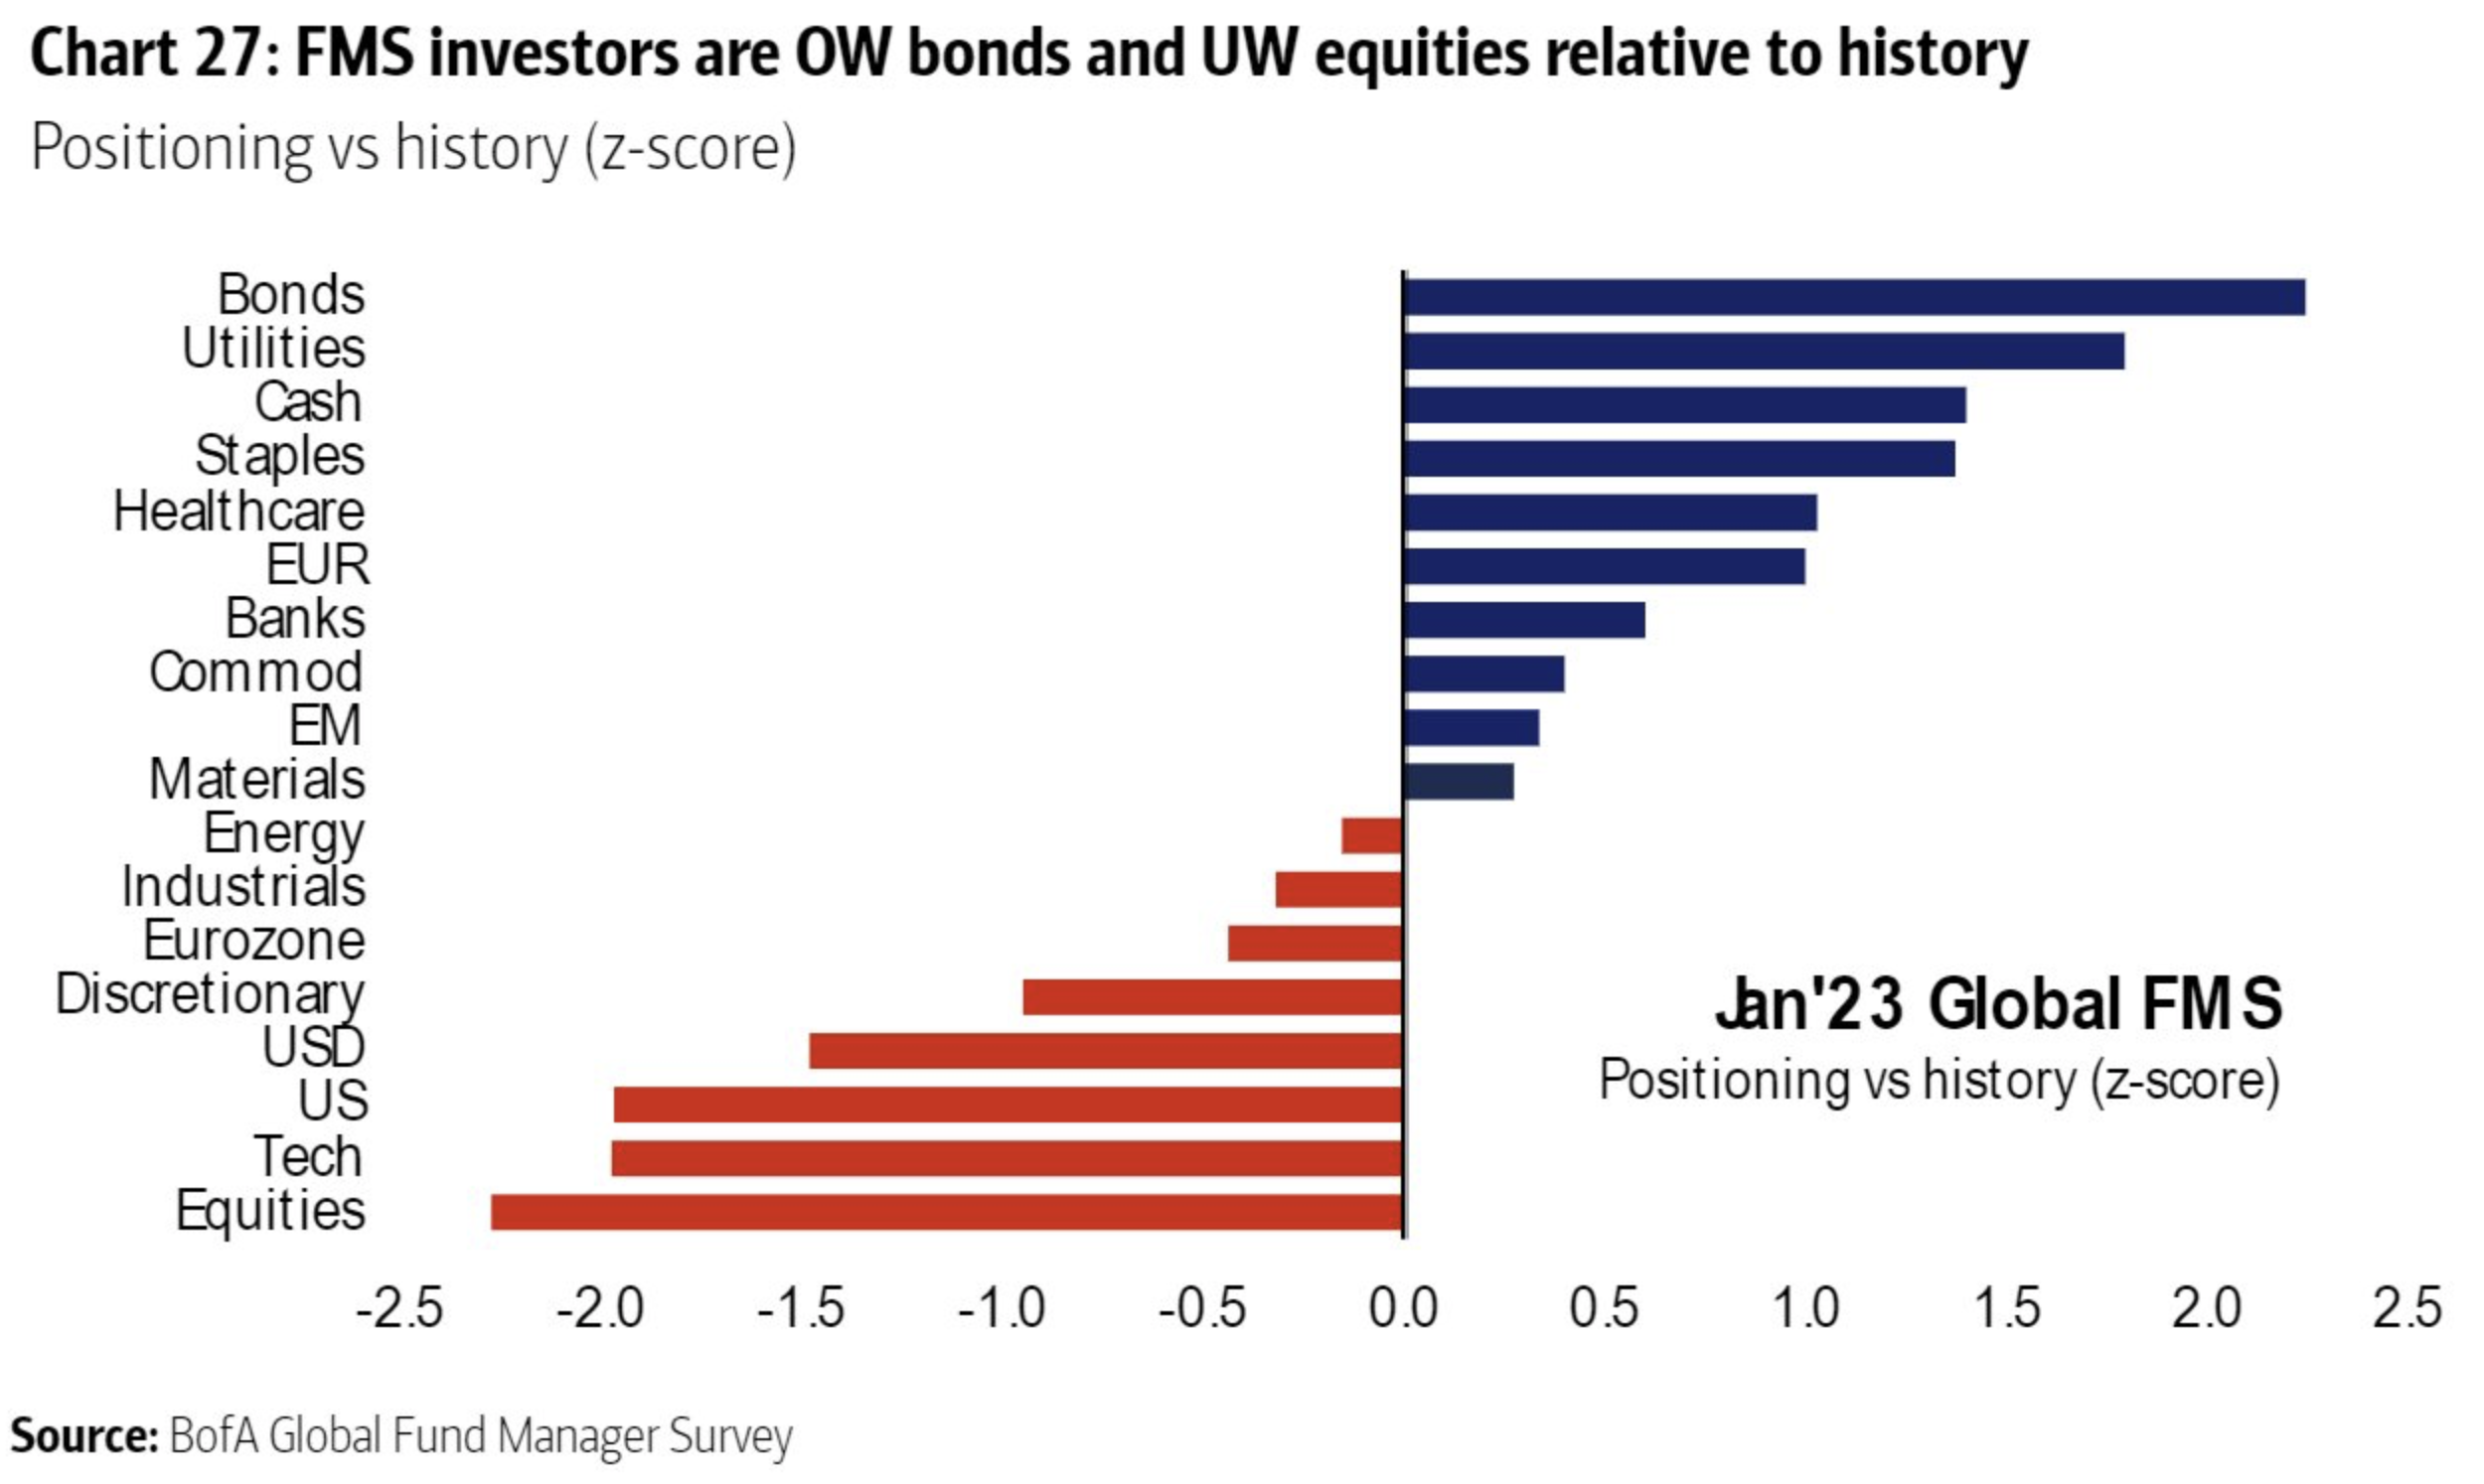
There are a ton of data points to assess each month to give us some idea of where risk-taking appetite is. Extreme positioning is the only thing I look for though. For the last few months, there was some extreme bearishness and positioning which led me to take more risk and add some tactical high beta brands to the portfolio. I’ve since sold those for some great short-term gains. Looking at the January data, positioning is still a bit off-sides and tilted toward being defensive, holding more cash, owning more bonds, and owning less US stocks. Bullishness towards European and especially Emerging Market equities is high, I’ve faded that move a bit by selling the Hermes and Ferrari for now, while trimming the LVMH big position. I’ve added some defensive exposure via healthcare brands UNH, REGN, and LLY with the funds from sales in higher beta and luxury brands. I like the balance I have right now.

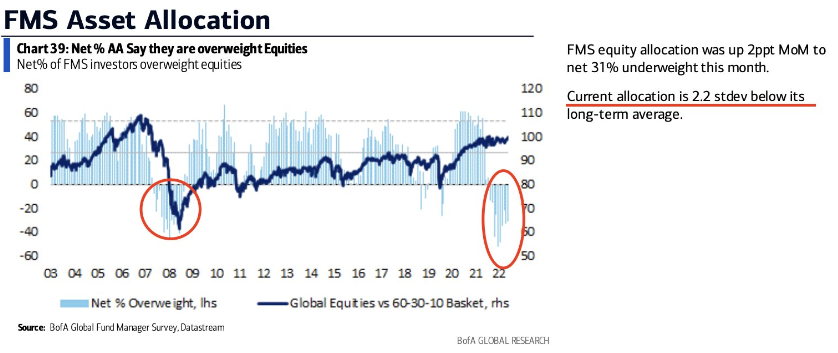
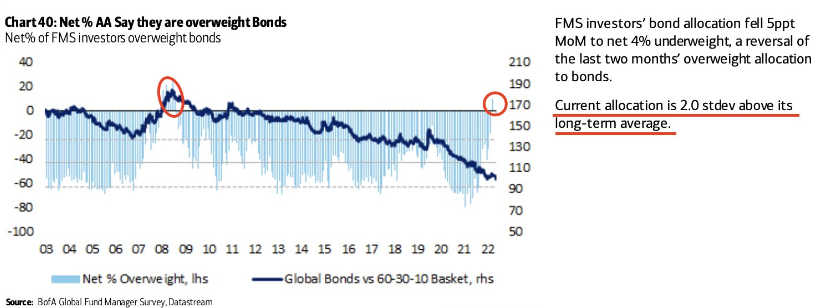
Here’s the BofA investment manager positioning data. I love seeing these monthly, once in a while the positioning extremes jump off the page and offer some real tactical trading opportunities. For now, I like adding to US stocks with the high quality balance sheet & GARP style factors present.

Still 2.2 standard deviations BELOW long term equity positioning average

Still 2 standard deviations ABOVE long term bond positioning average

Still .90 standard deviations ABOVE long term cash positioning average

Still 1.7 standard deviations BELOW long term U.S. equity positioning average

Sentiment and Positioning Remain Extreme

Happy new year!

We started the year with some good gains and the bears have come back ready for more downside it seems.

While I understand and appreciate the bearish bias people have for the next few months, my gosh is the boat crowded on one side. Bears are everywhere and even bulls are nervous. While the timing is always uncertain, if you have some duration and the ability to deal with higher VOL, historically speaking these are great times to be tranching into quality stocks, not running out of them. Here’s some charts to highlight the bearish bias.

Chart #1: consumer sentiment. When its under 60, forward returns tend to be above average. We got as low as 50 late in 2022.

Chart #2: Institutional money manager positioning is rarely this skewed away from equities and “risk assets”. Just think about how much money will run through a narrow door when some uncertainty is removed and consumers/investors feel less bad. It will happen all at once and the flows will be epic so whatever downside we have will quickly be recovered aka a 2009 type of move.

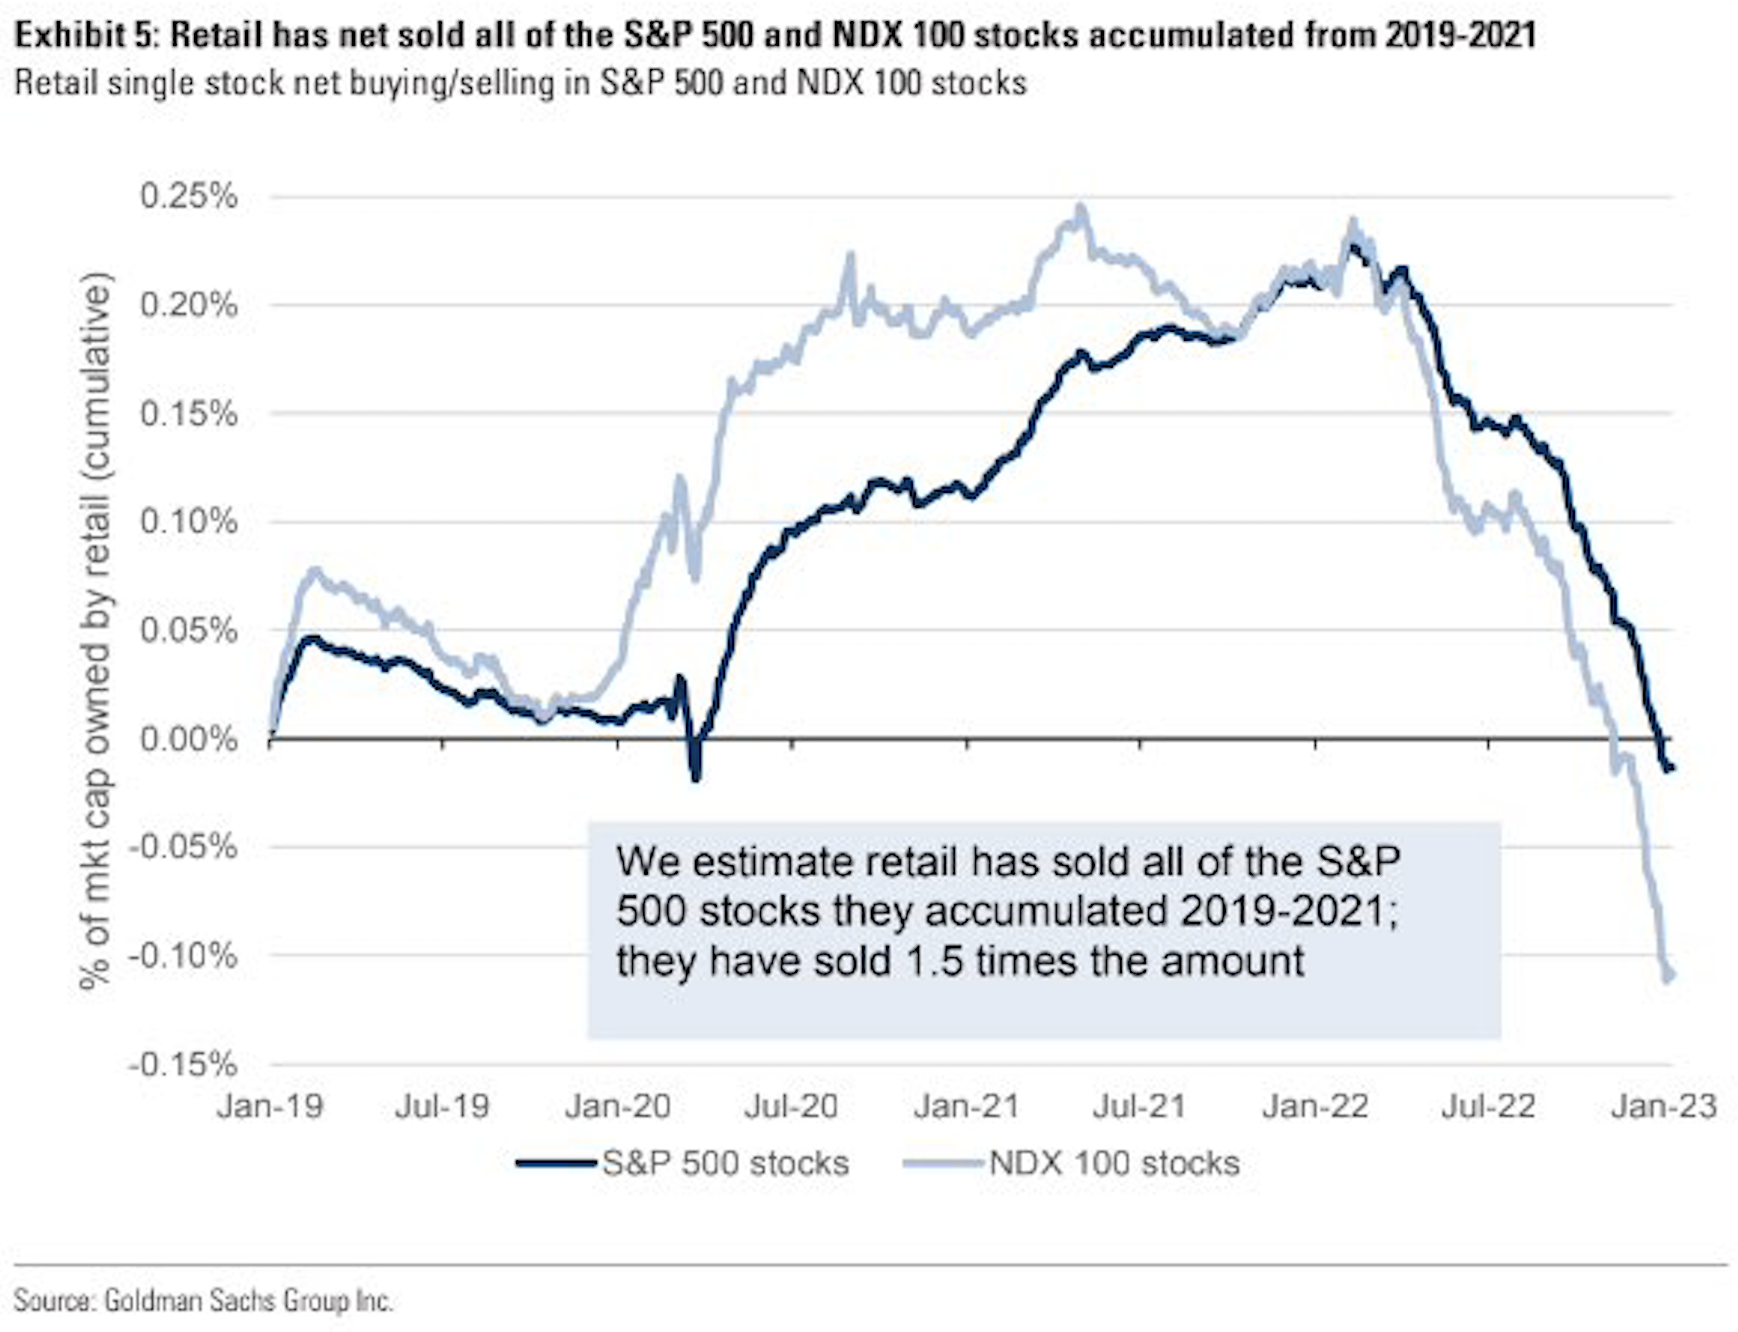
Chart #3: Redemptions have been enormous over the last 90 days. This chart from Goldman shows retail investors have net sold all of the S&P 500 and Nasdaq stocks they bought from 2019-2021, that’s alot of selling and a lot of new buying power at some point folks.

How has the stock market performed when EPS was between 10% & 25% LOWER than 1 year prior?

Very interesting stat from Ned Davis research showing the S&P 500’s annualized gain as a function of quarterly EPS growth.

Turns out, the best periods of stock performance ironically happen when EPS growth is between -10% and -25% as a YOY change. So with the world expecting 2023 to be a low growth or recession year, driving lower EPS growth, the bear cases which seem to be the consensus view currently, could be the best outcome for stocks!

That will make a bear choke on his dinner.