equities

Sentiment and Positioning Still Offsides?

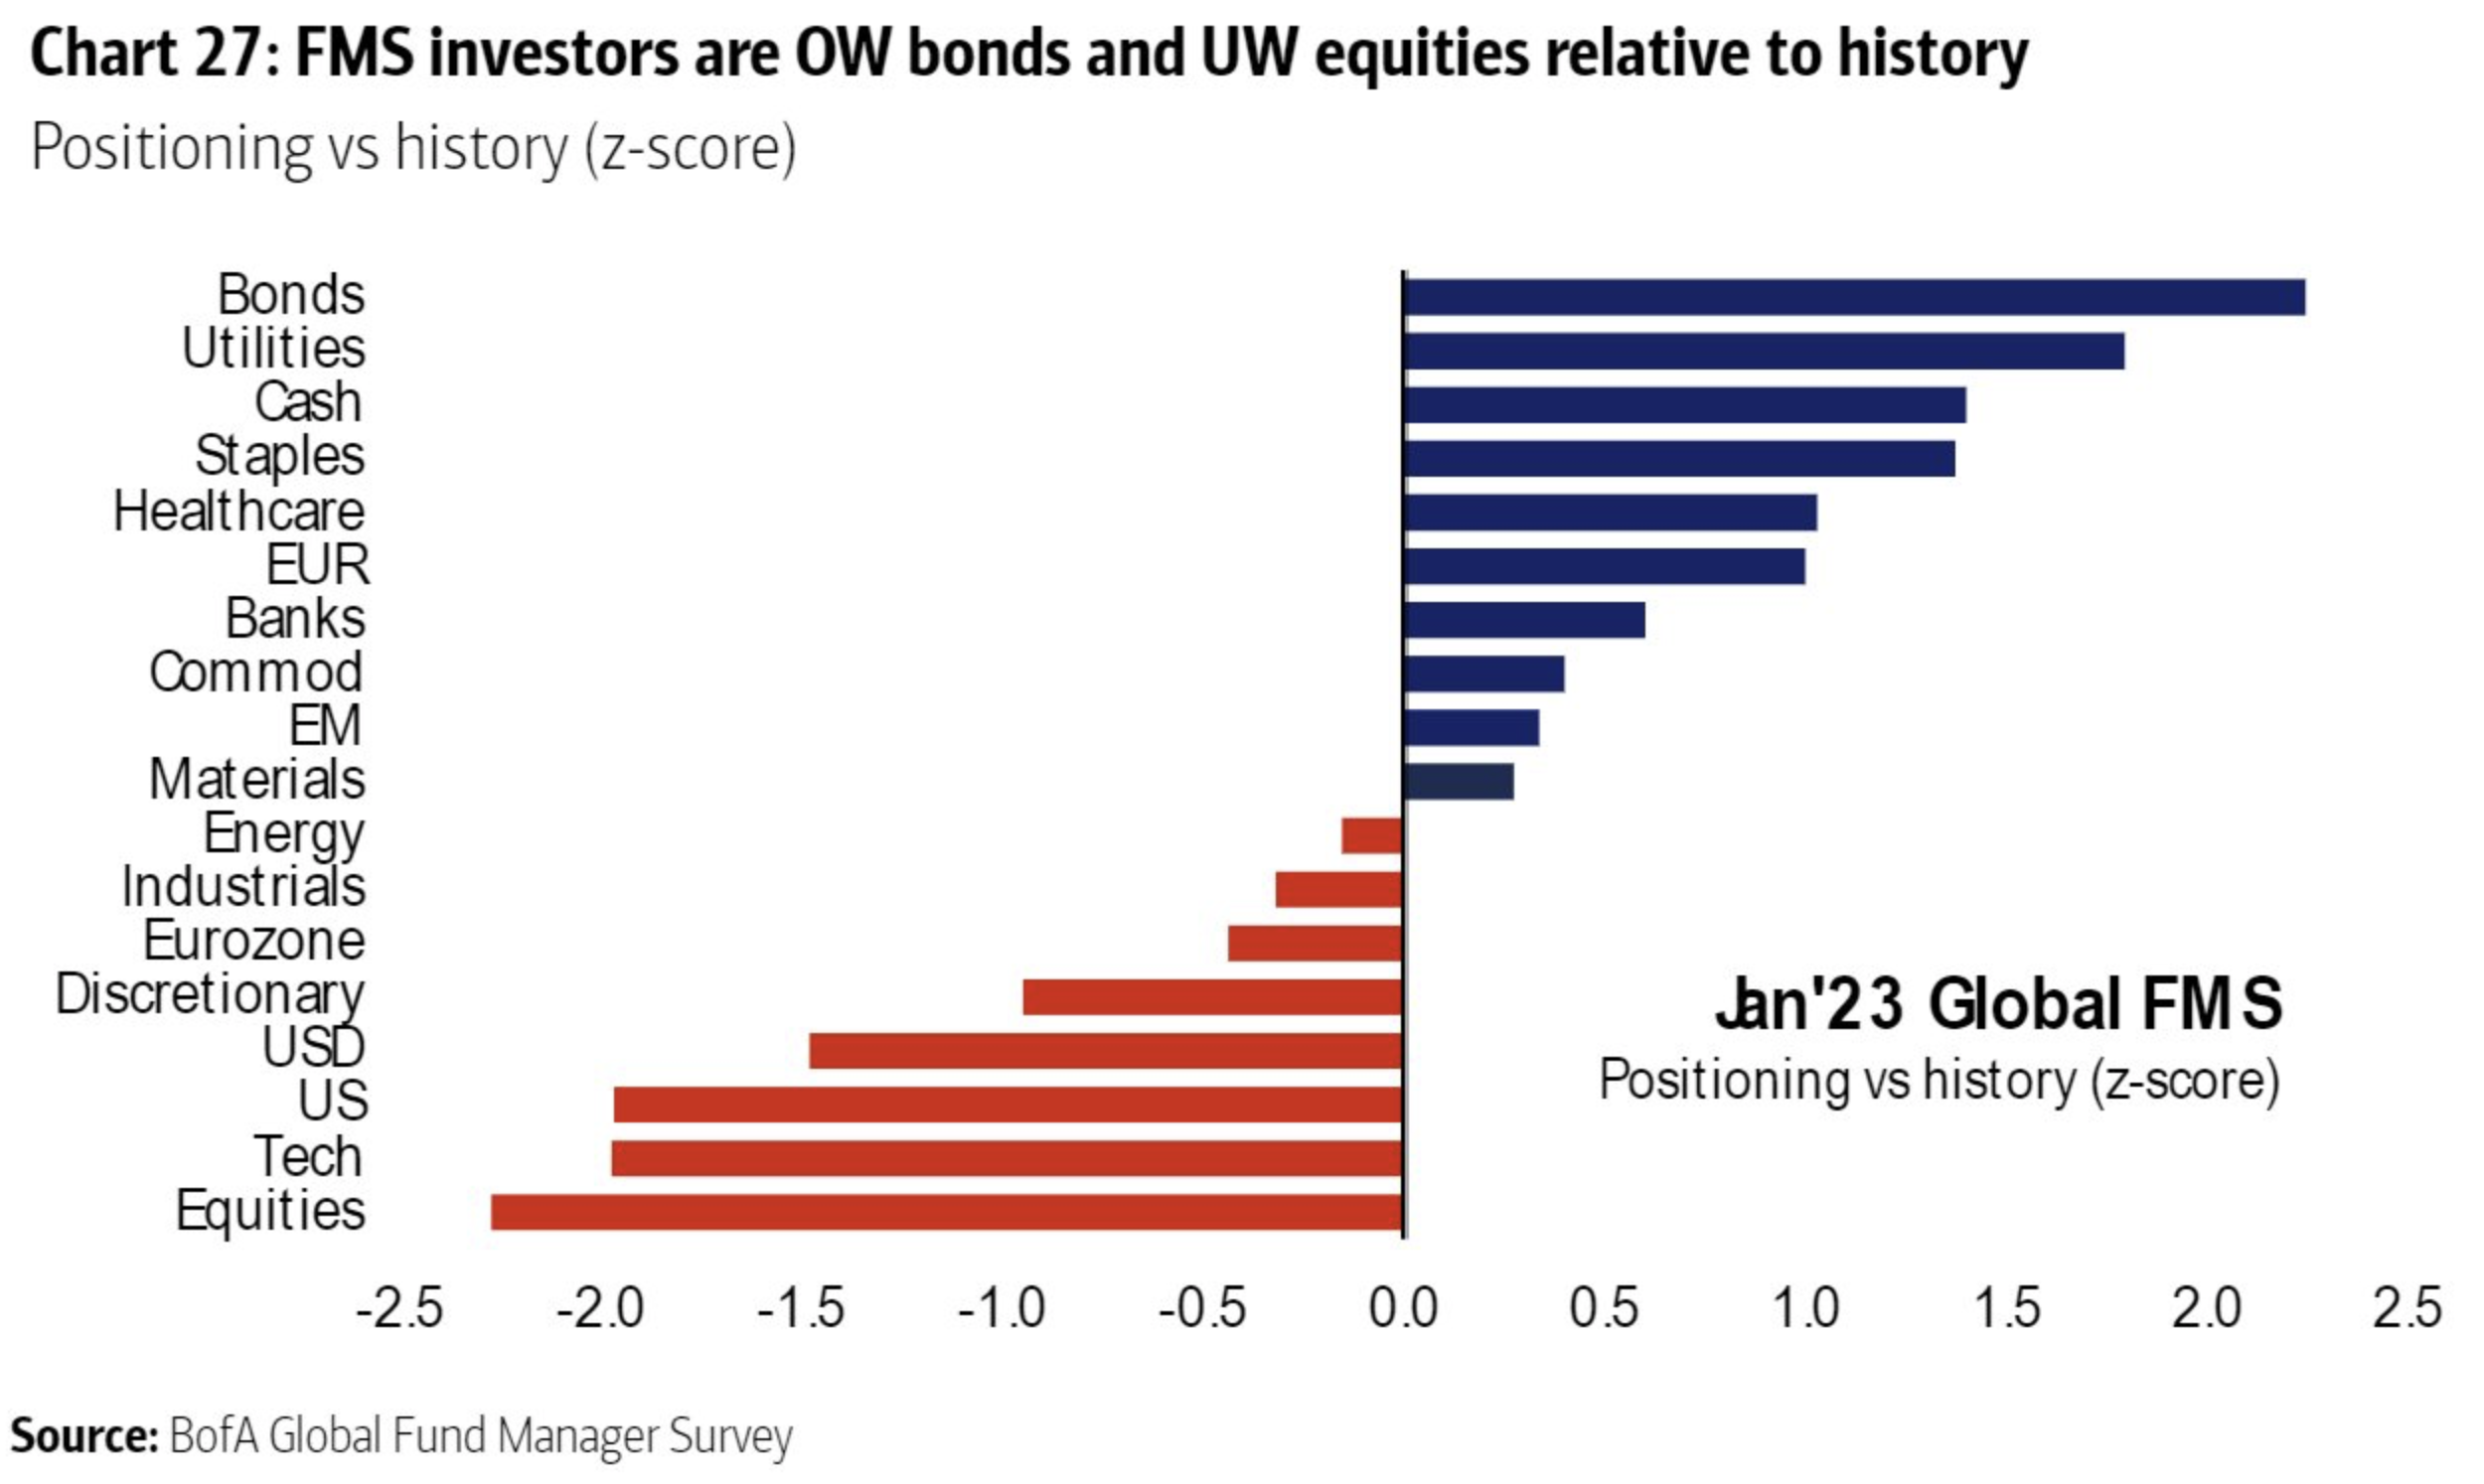
There are a ton of data points to assess each month to give us some idea of where risk-taking appetite is. Extreme positioning is the only thing I look for though. For the last few months, there was some extreme bearishness and positioning which led me to take more risk and add some tactical high beta brands to the portfolio. I’ve since sold those for some great short-term gains. Looking at the January data, positioning is still a bit off-sides and tilted toward being defensive, holding more cash, owning more bonds, and owning less US stocks. Bullishness towards European and especially Emerging Market equities is high, I’ve faded that move a bit by selling the Hermes and Ferrari for now, while trimming the LVMH big position. I’ve added some defensive exposure via healthcare brands UNH, REGN, and LLY with the funds from sales in higher beta and luxury brands. I like the balance I have right now.

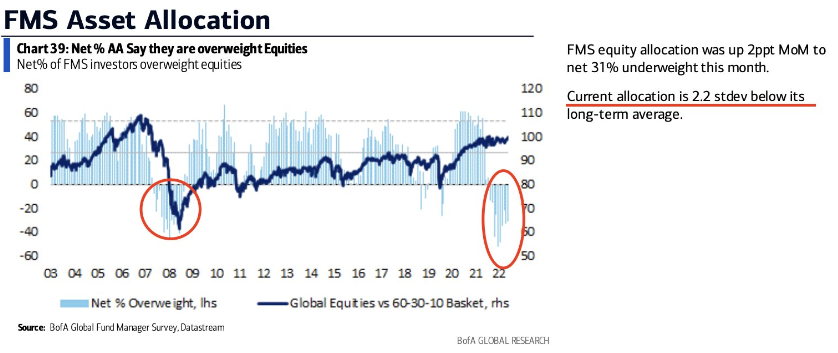
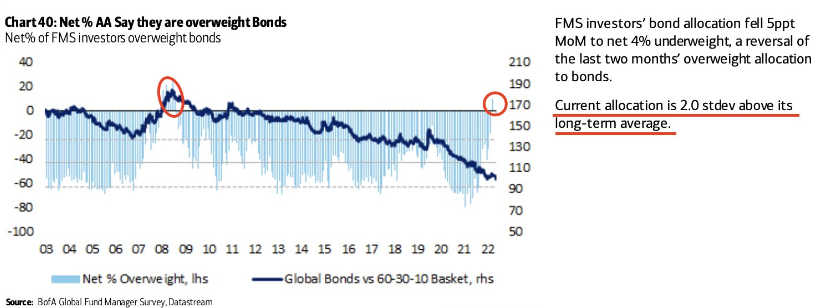
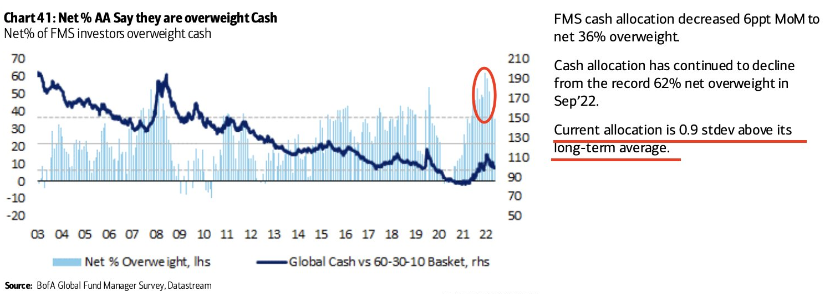
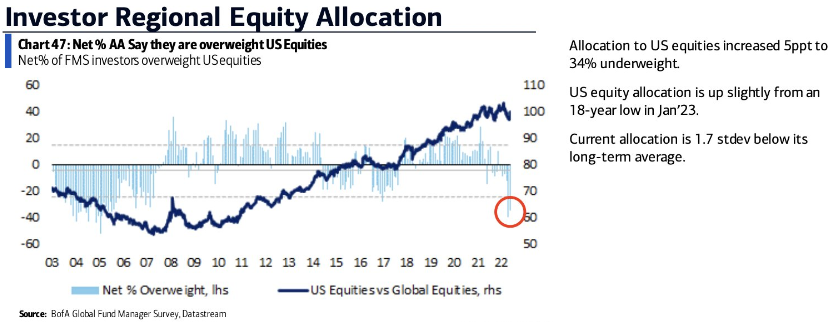
Here’s the BofA investment manager positioning data. I love seeing these monthly, once in a while the positioning extremes jump off the page and offer some real tactical trading opportunities. For now, I like adding to US stocks with the high quality balance sheet & GARP style factors present.

Still 2.2 standard deviations BELOW long term equity positioning average

Still 2 standard deviations ABOVE long term bond positioning average

Still .90 standard deviations ABOVE long term cash positioning average

Still 1.7 standard deviations BELOW long term U.S. equity positioning average

Sentiment and Positioning Remain Extreme

Happy new year!

We started the year with some good gains and the bears have come back ready for more downside it seems.

While I understand and appreciate the bearish bias people have for the next few months, my gosh is the boat crowded on one side. Bears are everywhere and even bulls are nervous. While the timing is always uncertain, if you have some duration and the ability to deal with higher VOL, historically speaking these are great times to be tranching into quality stocks, not running out of them. Here’s some charts to highlight the bearish bias.

Chart #1: consumer sentiment. When its under 60, forward returns tend to be above average. We got as low as 50 late in 2022.

Chart #2: Institutional money manager positioning is rarely this skewed away from equities and “risk assets”. Just think about how much money will run through a narrow door when some uncertainty is removed and consumers/investors feel less bad. It will happen all at once and the flows will be epic so whatever downside we have will quickly be recovered aka a 2009 type of move.

Chart #3: Redemptions have been enormous over the last 90 days. This chart from Goldman shows retail investors have net sold all of the S&P 500 and Nasdaq stocks they bought from 2019-2021, that’s alot of selling and a lot of new buying power at some point folks.