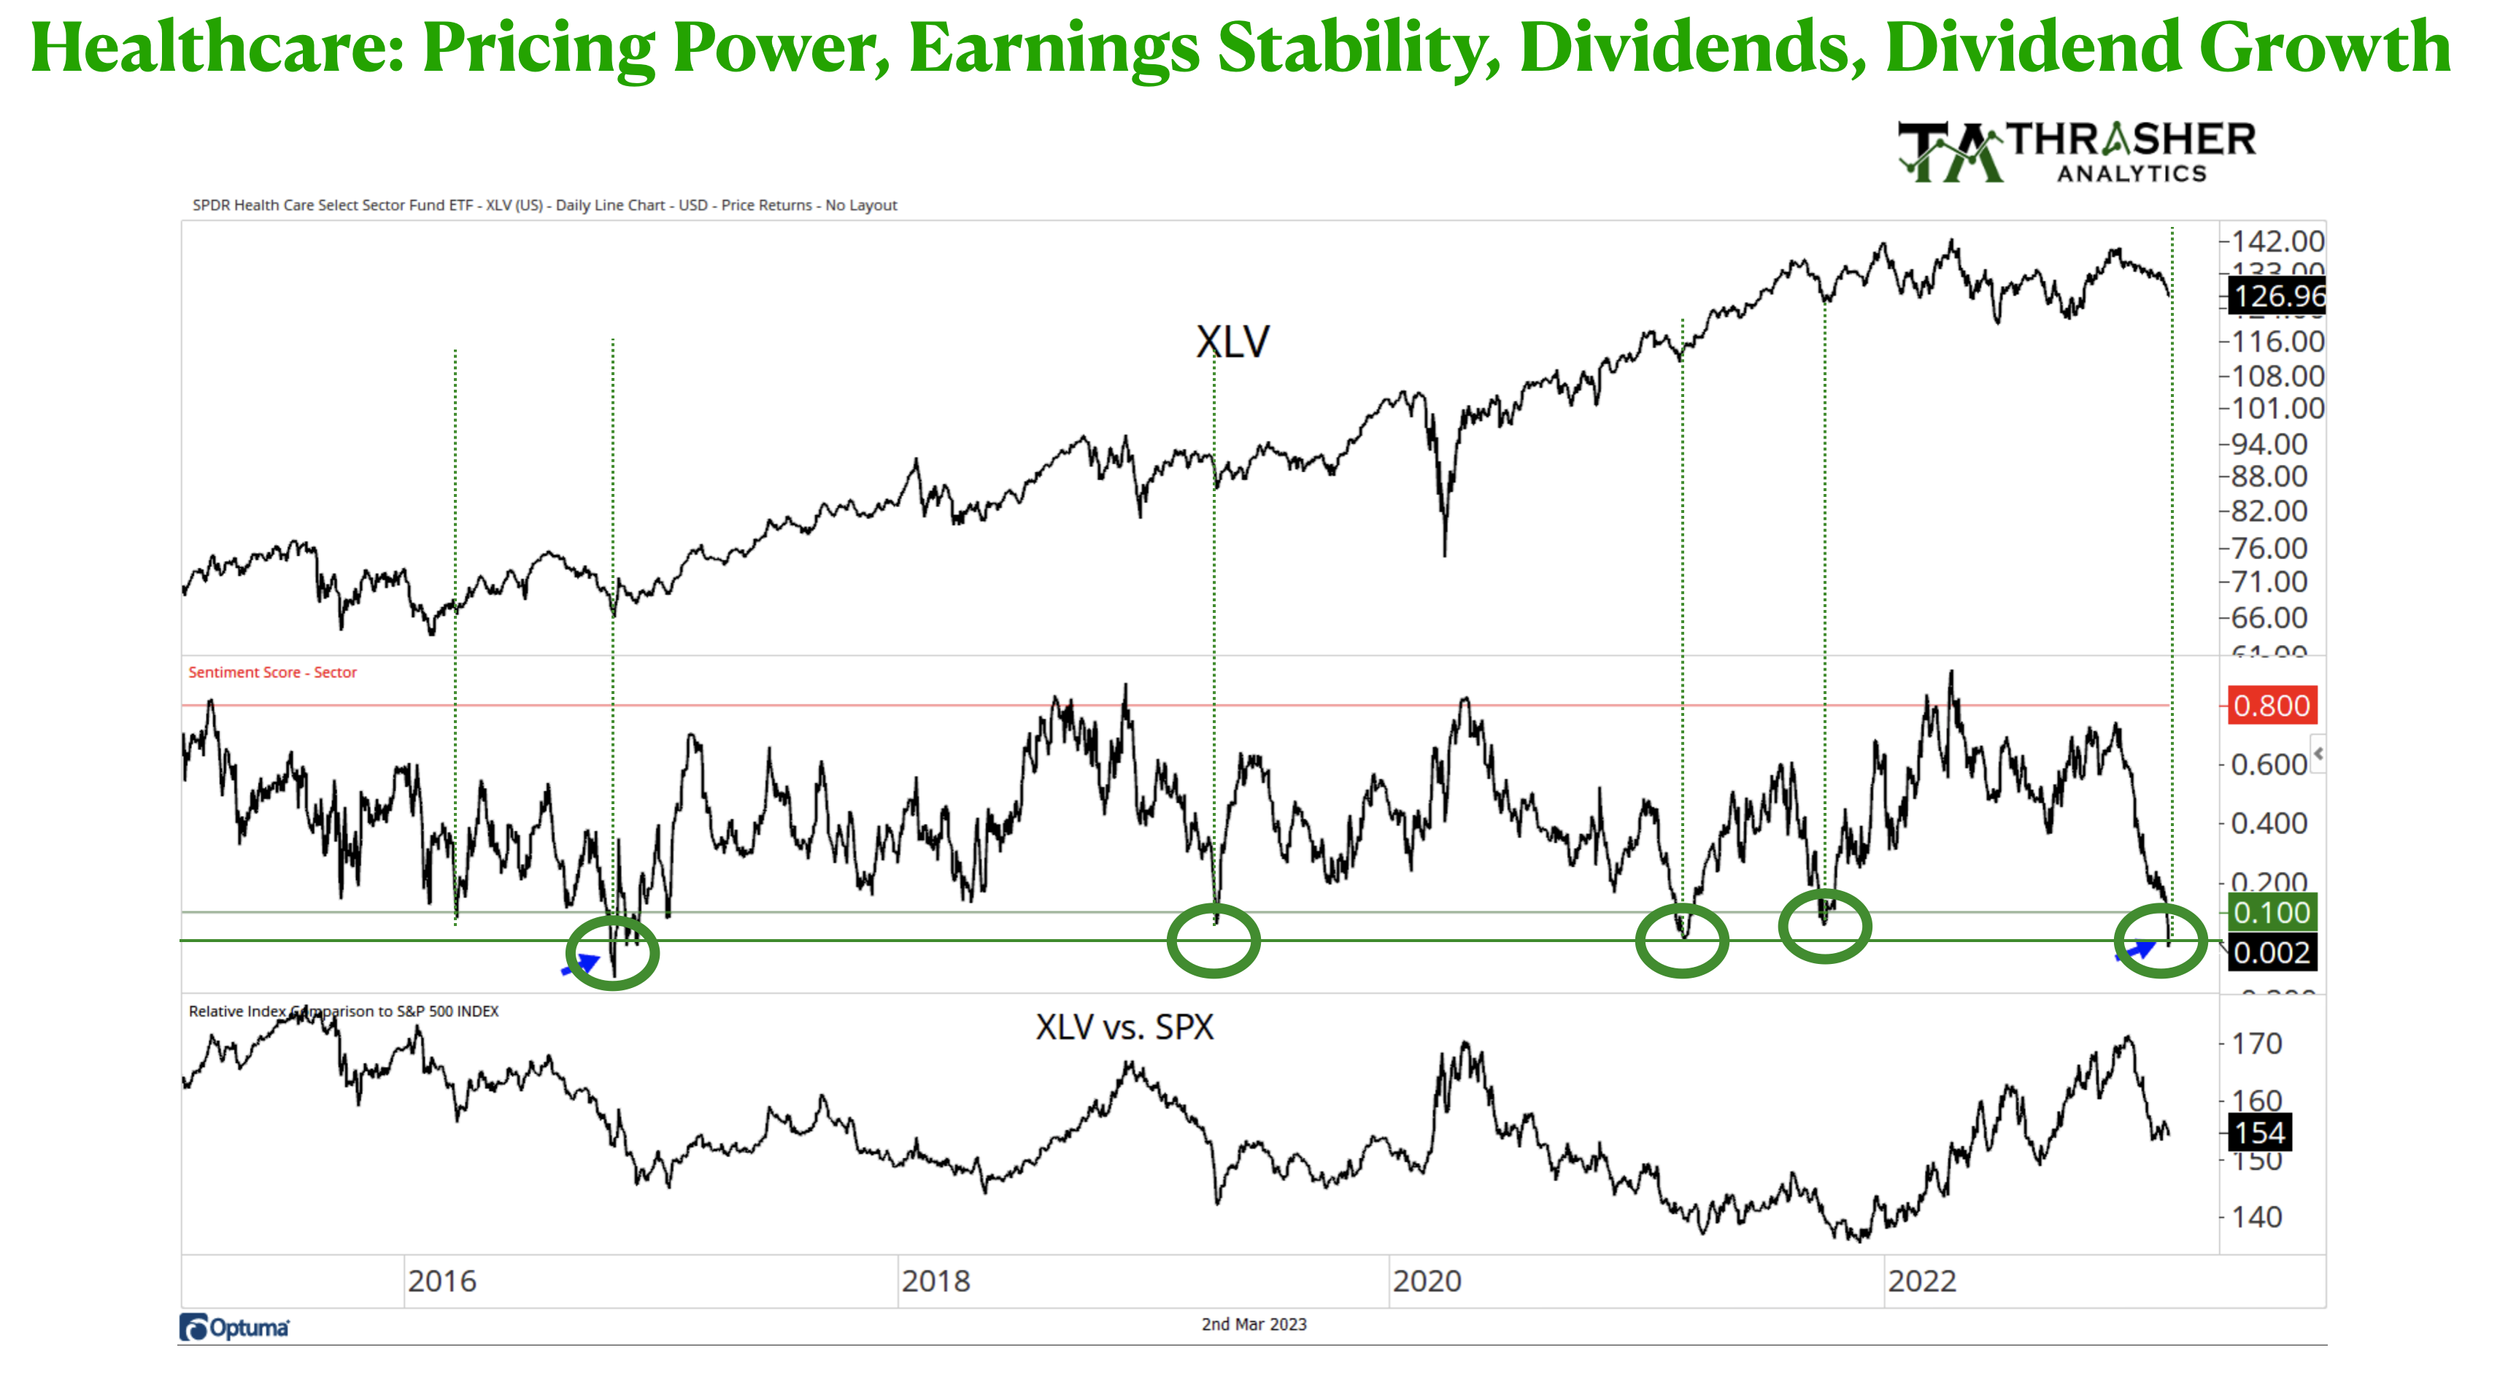
I love ratio charts, they compare one assets performance to another.
Today, we have a great post from @AndrewThrasher on Twitter who shows XLV relative to SPY.
Healthcare was a pretty good place to be last year along with staples and high dividend payers but thus far in 2023, healthcare has lagged pretty badly. As you know managed healthcare, biotech, pharma and med-Tech tend to be pretty defensive businesses, with good pricing power and they tend to generate good free cash flow and pay dividends or offer good dividend growth opportunities. After a big ramp in consumer and tech in January and a lagging return for healthcare, I started building an allocation to important HC names where we see good growth opportunities, strong potential stock upside potential based on appropriate multiples for the differentiation we think we are getting. We see some wonderful opportunities in the HC space and continue to build a bigger allocation to balance our exposure to more cyclical brands. Here’s the ratio chart showing the extreme nature of underperformance versus the market. This doesn’t mean both can’t go down further on any selling but it indicates HC could be a good place to generate some excess return versus the market now. We like UNH, LLY, TMO, and REGN. Managed Care, Life Sciences Tools and Diagnostics, Pharma and biotech innovation. FYI, I drew the vertical green lines to show other periods when relative performance of HC was this poor versus the market. Typically not a bad time to add to your positions.
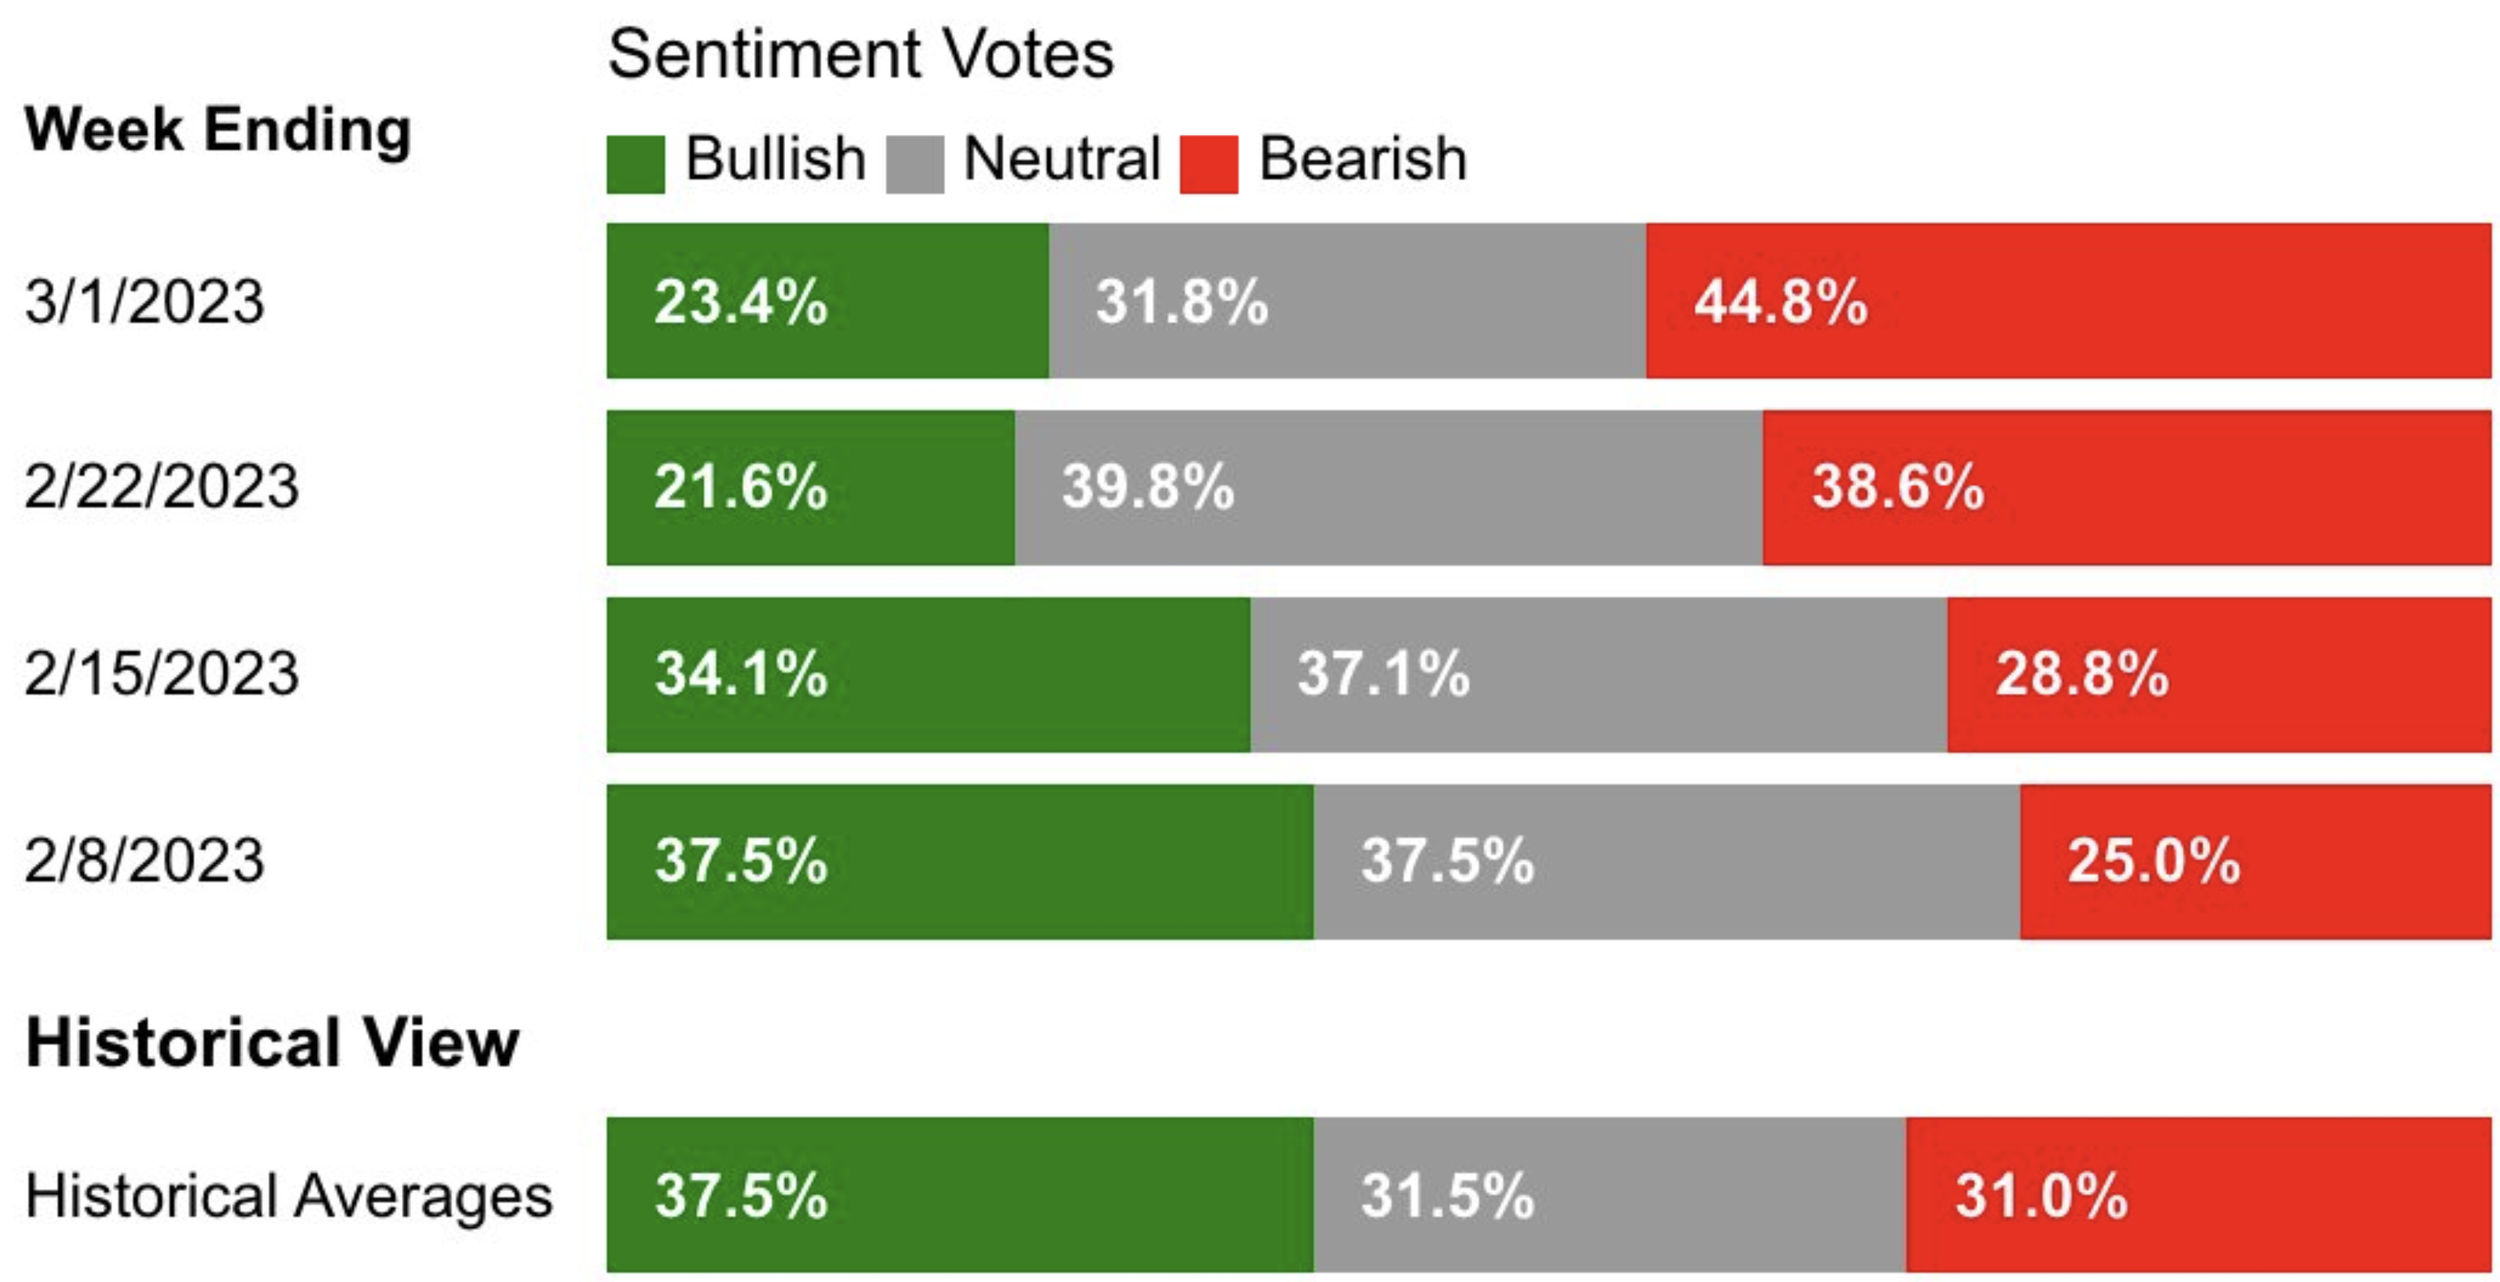
Consumer/Investor Sentiment continues to look like a roller coaster ride. Emotions make people do things they shouldn’t really do, which is why they need investments that save them from themselves. Bulls are now hiding and bears are everywhere.
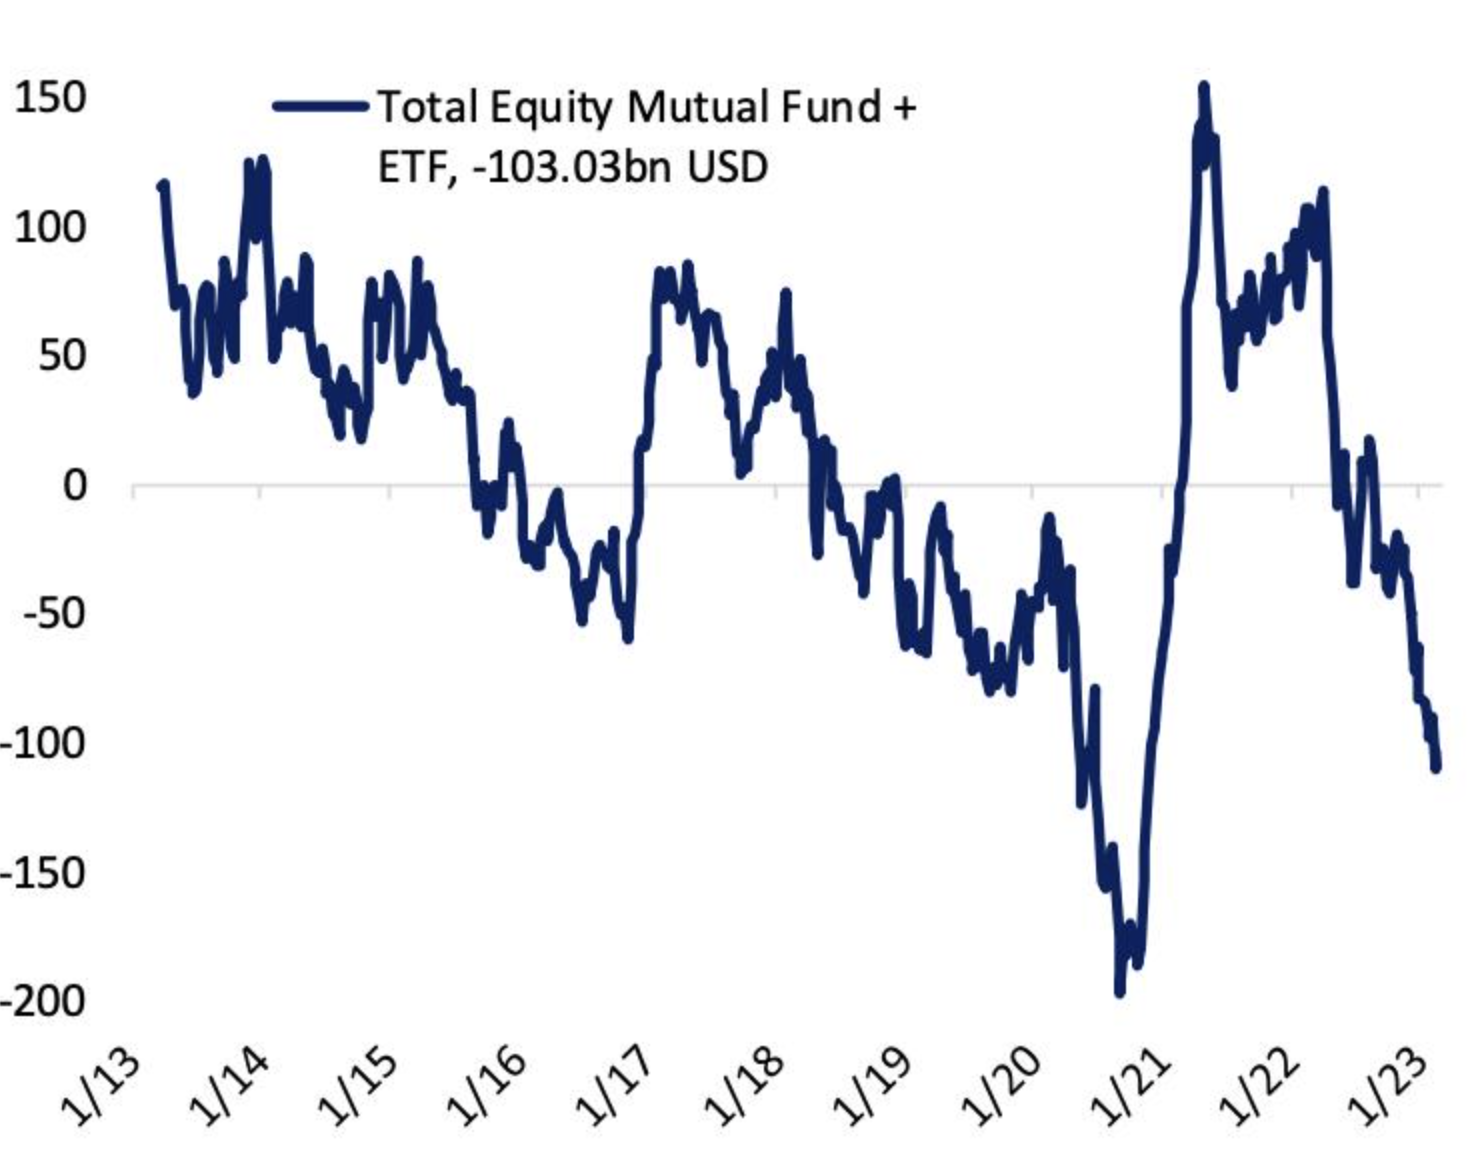
"More than $100bn has flowed out of equity mutual funds and ETFs on a combined basis over the past 13
weeks, one of the worst flow collapses on record" -@bespokeinvest