
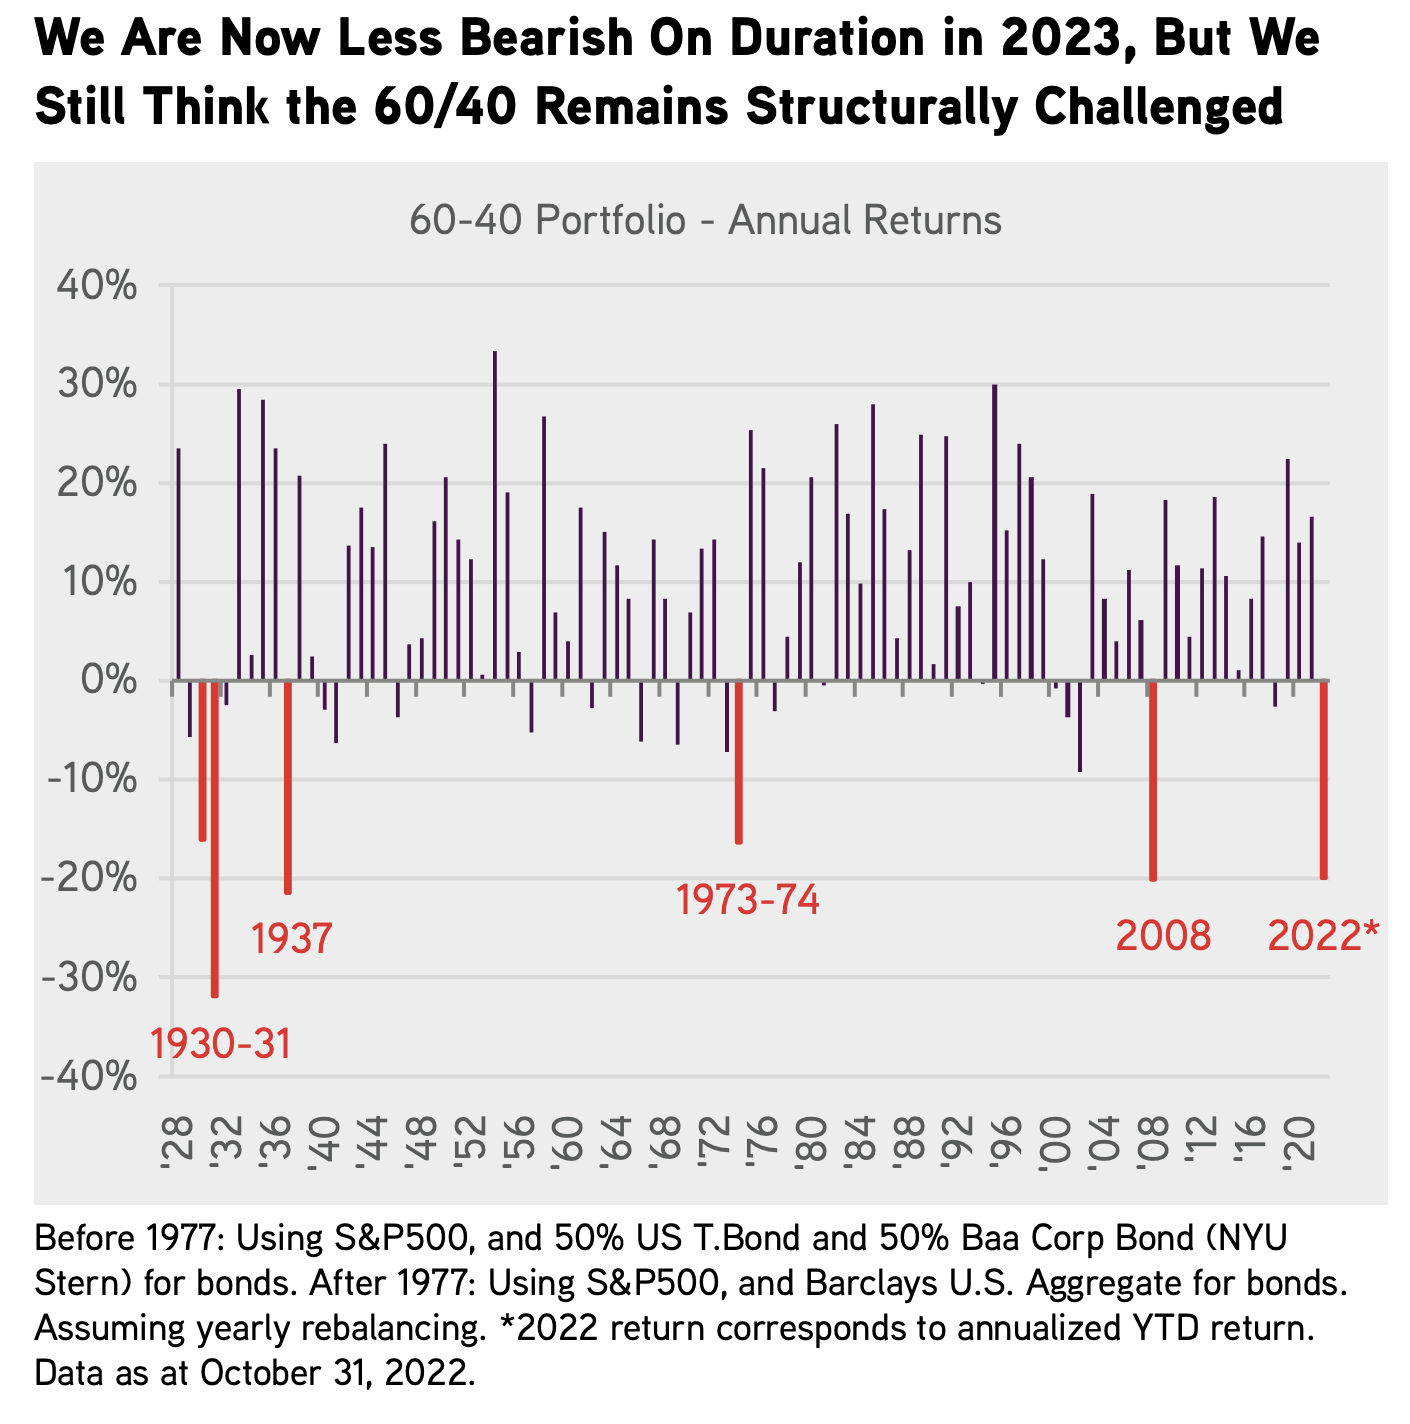
The road back to normal has been rocky. How do I know? Just look at most investment portfolio’s YTD. Very few asset classes have been spared, the typical 60/40 portfolio has performed more poorly than most other periods over the last century. Even if the seas will still be turbulent for another 2-4 months, better times lay ahead.
Investors must decide how to allocate for the next 1,3, and 5 years with a new normal in mind. The rate & cost of capital environment since roughly 2008 have been abnormally low when one looks back over the last 60+ years. Because ZIRP has largely been in place since 2008, to many, it feels like the norm but in reality, it is the exception. Here’s where we are now: we know with certainty; the Fed wants to normalize rates after holding them artificially low for over a decade. Man-made inflation gives them air-cover to do so. Every consumer and every investor needs to have a grasp of history in a higher rates and higher inflationary period. With that in mind, I wanted to offer some perspectives & only the facts. The last 16 years with zero-rates and abundant access to capital at almost zero cost is gone. People’s muscle memory needs to be re-set asap. Currently, the bears will say this reality makes it difficult for asset price appreciation so rather than opine with an opinion, I wanted to look back in time to see what happened in other periods when rates and inflation were higher. The data source for Fed Funds & CPI data come from the St. Louis Fed website and the S&P 500 data are from Bloomberg.
If I was a betting man, I would guess the next 5 years looks like a Fed Funds average rate of between 4-5% and a CPI that averages 4% which just happens to be in-line with the long-term ranges. Here’s a graph showing how the smart professionals at KKR see the next few years. In short: growth is generally fine and inflation metrics mean revert towards long-term norms.

Conventional wisdom states, when GDP peaks and falls precipitously, asset prices also fall. Logically, it makes sense but sometimes markets have their own plan. Here’s a very interesting datapoint I found shocking when doing this exercise.
GDP peaked in 1984 at 7.24%. At the end of 1984, Fed Funds was 8.38%, that’s TWICE what it is today but those were wild times. CPI was 4%, likely where we expect it to be for the next few years. GDP generally fell into the 1991 trough of -0.11% before rebounding to 3.52% in 1992. If I told you what GDP would have done between 1984 and 1991, you would have guessed the stock market got absolutely crushed right? Below are the actual results. Intuitively, we know markets discount the future in advance and the market fell about 26% from the peak Fed Funds around 15-19% from late 1980 into Q3 1982. That was a very different time than we expect in 2022-2025 so I take odds with people expecting similar outcomes from a very different economy and set of variables.
Period: 1984 Peak GDP to 1991 Trough GDP: 7.24% Peak GDP to -0.11% Trough GDP
“Consumers are tapped out”. That’s a very popular phrase today and has been popular for about 70 years.
The truth about consumer spending is more nuanced as you might guess. When we feel good and are flush with cash, we spend more and do more discretionary purchases. When we are nervous or have less cash in our pockets, we make important decisions about what is vital and important and what spending can be deferred. With very few instances over time, consumer spending does NOT fall very much. To illustrate this, below is the long-term chart of Personal Consumption Expenditures and then a very condensed period when Fed Funds & CPI was very high. The assumption is when rates and inflation are high, consumers get squeezed and spending falls along with stocks and asset prices. The period in question is 12/1/1978 to 12/31/1981. When this period started, Fed Funds was a whopping 10% and CPI was 9%. I’ve listed 1978-1981 first. IN the 1980 recession, consumption fell but it was by no means a “collapse”. Spending is in a consumer’s DNA.

Here’s a wider lens chart of consumption and GDP over a tough period for inflation, 1968 to 1981 with recessions annotated. The line is very clear, it keeps going up and to the right. And remember, Millennials and GenZ are two population cohorts that are bigger than baby boomers and they are sitting in their peak earning and spending cycles for many decades and inheriting over $40 trillion over the next 20 years. It’s hard for me to imagine spending falling on a consistent basis given this positive demographic factor that few take into account. Heres the consumption chart from 1968 to 1981, CPI averaged 7.6% over this 13+ year period. Up and to the right.

In today’s volatile times, I think it’s important to remember, the storm happens during the “normalization” process which for rates and inflation, is well under way. At a new Fed Funds range of 4.25%-4.5%, we are well past 2/3 of the way to our longer term destination. Because rates and the cost of capital were artificially held too low for too long, there will continue to be zombie companies floating to the top over the next few years. Please make sure you move up in quality, focus on positive and growing free cash flow businesses and avoid companies that need access to capital to fund operations, that capital is alot more expensive today. I am a huge fan of the Private Equity brands currently because they will feast on the carcasses of the companies that ran their businesses like free capital would never end.
Below, I have highlighted a handful of periods that show what more normal periods look like in monetary policy, inflation and GDP, particularly to compare them to the most recent period starting with Ben Bernanke in 2006, then Yellen, and now Powell. As you can see from the image directly below, from 1955 to Bernanke’s arrival at the Fed, normal fed funds was around 5.5%, normal CPI was about 4% and stocks provided an attractive return. In the next chart, we look at the abnormal period we have all become accustomed to where fed funds is ultra low, CPI is ultra low but equity returns are elevated. On the surface, this looks like a better solution, but the rampant speculation and funding of terrible business models and mis-allocations of capital ultimately end up being more destructive than a more logical range of monetary policy with an appropriate cost of capital. What’s the moral of the story? Investors should expect more normal equity returns than what we think we deserve. We still have a bit of normalization to go, so we should expect volatility to linger for a bit longer, but once we are at a normal place and the rules of the road are more well known, asset markets should settle down and macro won’t be as front & center. Ultimately, its company fundamentals that drive stock prices. History shows, stocks do just fine in periods with higher cost of capital, higher interest rates, and higher inflation than we think is “normal”. Why? because shitty businesses find it hard to get funding, and markets purge the bad and feed the good. Here’s the data:
Normal Fed Policy & Inflationary Period: 1955 to February 2006 when Ben Bernanke Arrived at the Fed
Unsustainable Fed Policy - ZIRP & Free Money Period: Bernanke, Yellen, Powell Period: 2006 - Today
An Example of Normal Policy via the Greenspan Era: 1987 to 2006
Below, I have outlined 5 periods with Fed Funds & CPI ranges most similar to where we are now and likely to stay over the next few years. Spoiler alert: Stocks performed just fine. Once the market get’s more comfortable with the terminal rate, stocks should bottom and revert back to “normal trends”, if history is a guide.
Period #1: 7/1/1963 to 11/1/1968
Period #2: 8/1/1970 to 1/1/1973
Period #3: 3/1/1975 to 8/1/1977
Period #4: 5/1/1991 to 5/1/2001
Period #5: 8/1/2005 to 1/1/2008
For fun, let’s see the statistics for an elongated period of higher Fed Funds & inflation so we know how markets performed in an outlier period relative to “normal”.